Kroger 2013 Annual Report Download - page 87
Download and view the complete annual report
Please find page 87 of the 2013 Kroger annual report below. You can navigate through the pages in the report by either clicking on the pages listed below, or by using the keyword search tool below to find specific information within the annual report.-
 1
1 -
2
-
3
-
4
-
5
-
6
-
7
-
8
-
9
-
10
-
11
-
12
-
13
-
14
-
15
-
16
-
17
-
18
-
19
-
20
-
21
-
22
-
23
-
24
-
25
-
26
-
27
-
28
-
29
-
30
-
31
-
32
-
33
-
34
-
35
-
36
-
37
-
38
-
39
-
40
-
41
-
42
-
43
-
44
-
45
-
46
-
47
-
48
-
49
-
50
-
51
-
52
-
53
-
54
-
55
-
56
-
57
-
58
-
59
-
60
-
61
-
62
-
63
-
64
-
65
-
66
-
67
-
68
-
69
-
70
-
71
-
72
-
73
-
74
-
75
-
76
-
 77
77 -
 78
78 -
 79
79 -
 80
80 -
 81
81 -
 82
82 -
 83
83 -
 84
84 -
 85
85 -
 86
86 -
 87
87 -
 88
88 -
 89
89 -
 90
90 -
 91
91 -
 92
92 -
 93
93 -
 94
94 -
 95
95 -
 96
96 -
 97
97 -
98
-
99
-
100
-
101
-
102
-
103
-
104
-
105
-
106
-
107
-
108
-
109
-
110
-
111
-
112
-
113
-
114
-
115
-
116
-
117
-
118
-
119
-
120
-
121
-
122
-
123
-
124
-
125
-
126
-
127
-
128
-
129
-
130
-
131
-
132
-
133
-
134
-
135
-
136
-
137
-
138
-
139
-
140
-
141
-
142
-
143
-
144
-
145
-
146
-
147
-
148
-
149
-
150
-
151
-
152
 |
 |

A-14
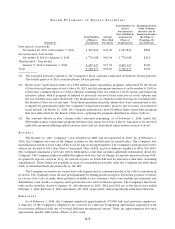
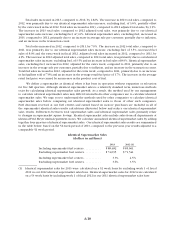
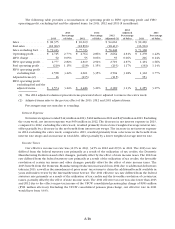
The following table provides a reconciliation of operating profit to FIFO operating profit and FIFO
operating profit, excluding fuel and the adjusted items, for 2013, 2012 and 2011 ($ in millions):
2013
2013
Percentage
of Sales 2012
2012
Percentage
of Sales
2012
Adjusted (1)
2012
Adjusted
Percentage
of Sales 2011
2011
Percentage
of Sales
Sales ................ $ 98,375 $ 96,619 $ 94,661 $ 90,269
Fuel sales ............ (18,962) (18,896) (18,413) (16,901)
Sales excluding fuel .... $ 79,413 $ 77,723 $ 76,248 $ 73,368
Operating profit....... $ 2,725 2.77% $ 2,764 2.86% $ 2,664 2.81% $ 1,278 1.42%
LIFO charge .......... 52 0.05% 55 0.06% 55 0.06% 216 0.24%
FIFO operating profit... 2,777 2.82% 2,819 2.92% 2,719 2.87% 1,494 1.66%
Fuel operating profit ... (219) 1.15% (218) 1.15% (215) 1.17% (192) 1.14%
FIFO operating profit
excluding fuel...... 2,558 3.22% 2,601 3.35% 2,504 3.28% 1,302 1.77%
Adjusted items (2) ..... 16 (115) (115) 953
FIFO operating profit
excluding fuel and the
adjusted items...... $ 2,574 3.24% $ 2,486 3.20% $ 2,389 3.13% $ 2,255 3.07%
(1) The 2012 adjusted column represents items presented above adjusted to remove the extra week.
(2) Adjusted items refer to the pre-tax effect of the 2013, 2012 and 2011 adjusted items.
Percentages may not sum due to rounding.
Interest Expense
Net interest expense totaled $443 million in 2013, $462 million in 2012 and $435 million in 2011. Excluding
the extra week, net interest expense was $454 million in 2012. The decrease in net interest expense in 2013,
compared to 2012, excluding the extra week, resulted primarily from a lower weighted average interest rate,
offset partially by a decrease in the net benefit from interest rate swaps. The increase in net interest expense
in 2012 excluding the extra week, compared to 2011, resulted primarily from a decrease in the benefit from
interest rate swaps and an increase in total debt, offset partially by a lower weighted average interest rate.
Income Taxes
Our effective income tax rate was 32.9% in 2013, 34.5% in 2012 and 29.3% in 2011. The 2013 tax rate
differed from the federal statutory rate primarily as a result of the utilization of tax credits, the Domestic
Manufacturing Deduction and other changes, partially offset by the effect of state income taxes. The 2012 tax
rate differed from the federal statutory rate primarily as a result of the utilization of tax credits, the favorable
resolution of certain tax issues and other changes, partially offset by the effect of state income taxes. The
2013 benefit from the Domestic Manufacturing Deduction increased from 2012 due to additional deductions
taken in 2013, as well as the amendment of prior years’ tax returns to claim the additional benefit available in
years still under review by the Internal Revenue Service. The 2011 effective tax rate differed from the federal
statutory rate primarily as a result of the utilization of tax credits and the favorable resolution of certain tax
issues, partially offset by the effect of state income taxes. The 2011 effective tax rate was also lower than 2013
and 2012 due to the effect on pre-tax income of the UFCW consolidated pension plan charge of $953 million
($591 million after-tax). Excluding the UFCW consolidated pension plan charge, our effective rate in 2011
would have been 33.9%.