Kroger 2013 Annual Report Download - page 30
Download and view the complete annual report
Please find page 30 of the 2013 Kroger annual report below. You can navigate through the pages in the report by either clicking on the pages listed below, or by using the keyword search tool below to find specific information within the annual report.-
 1
1 -
2
-
3
-
4
-
5
-
6
-
7
-
8
-
9
-
10
-
11
-
12
-
13
-
14
-
15
-
16
-
17
-
18
-
19
-
 20
20 -
 21
21 -
 22
22 -
 23
23 -
 24
24 -
 25
25 -
 26
26 -
 27
27 -
 28
28 -
 29
29 -
 30
30 -
 31
31 -
 32
32 -
 33
33 -
 34
34 -
 35
35 -
 36
36 -
 37
37 -
 38
38 -
 39
39 -
 40
40 -
41
-
42
-
43
-
44
-
45
-
46
-
47
-
48
-
49
-
50
-
51
-
52
-
53
-
54
-
55
-
56
-
57
-
58
-
59
-
60
-
61
-
62
-
63
-
64
-
65
-
66
-
67
-
68
-
69
-
70
-
71
-
72
-
73
-
74
-
75
-
76
-
77
-
78
-
79
-
80
-
81
-
82
-
83
-
84
-
85
-
86
-
87
-
88
-
89
-
90
-
91
-
92
-
93
-
94
-
95
-
96
-
97
-
98
-
99
-
100
-
101
-
102
-
103
-
104
-
105
-
106
-
107
-
108
-
109
-
110
-
111
-
112
-
113
-
114
-
115
-
116
-
117
-
118
-
119
-
120
-
121
-
122
-
123
-
124
-
125
-
126
-
127
-
128
-
129
-
130
-
131
-
132
-
133
-
134
-
135
-
136
-
137
-
138
-
139
-
140
-
141
-
142
-
143
-
144
-
145
-
146
-
147
-
148
-
149
-
150
-
151
-
152
 |
 |

28
Thefollowingtablesummarizeseachofthelong-termperformancebasedplansfortheyearsshown:
2011 Plan 2012 Plan 2013 Plan 2014 Plan
Performance Period 2011 to 2013 2012 to 2014 2013to2015 2014to2016
Payout Date March2014 March2015 March2016 March2017
Cash Bonus Base Salaryatendof
fiscalyear2010*
Salaryatendof
fiscalyear2011*
Salaryatendoffiscal
year2012*
Salaryatendoffiscal
year2013*
Performance Metrics
Strategic Plan 2%payoutperunit
improvement
2%payoutperunit
improvement
2%payoutperunit
improvement
2%payoutperunit
improvement
Reduction in
Operating Cost as
a Percentage of
Sales, Excluding
Fuel
0.50%payoutper
0.01%reductionin
operating costs
Baseline:27.60%
0.50%payoutper
0.01%reductionin
operating costs
Baseline:27.09%
0.50%payoutper
0.01%reductionin
operating costs
Baseline:26.69%
0.50%payoutper
0.01%reductionin
operating costs
Baseline:26.61%
Improvement
in Associate
Engagement
2%payoutperunit
improvement
4%payoutperunit
improvement
4%payoutperunit
improvement
4%payoutperunit
improvement
Return on
Invested Capital
N/A N/A 1%payoutper0.01%
improvement in ROIC
Baseline:13.41%
1%payoutper0.01%
improvement in ROIC
Baseline:13.43%
* Ordateofplanentry,iflater.
Atthetimeofadoptingnewlong-termplans,theCommitteehasmadeadjustmentstothepercentage
payouts for the components of the long-term plans to account for the increasing difficulty of achieving
compounded improvement.
The Committee anticipates adopting a new plan each year, measuring improvement over successive
three-yearperiods.
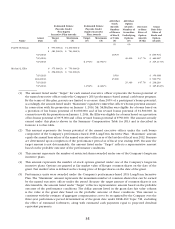
Thelong-termperformancebasedplanadoptedin2011,whichmeasuredimprovementsthroughfiscal
year2013,paidoutinMarch2014andwascalculatedasfollows:
Component Baseline Result Improvement Multiplier
Percentage
Earned
StrategicPlan..................... * * 6unitsofimprovement 2% 12.00%
Associate Engagement ............. * * 8 units of improvement 2% 6.00%
Operating Costs, as a Percentage of
Sales,ExcludingFuel ............ 27.6 0 % 26.76% 84basispointimprovement 0.50% 42.00%
Total Earned ...................... 70.00%
* TheStrategicPlanandAssociateEngagementcomponentswereestablishedbytheCommitteebutare
not disclosed as they are competitively sensitive.
Accordingly,eachnamedexecutiveofficerreceivedcashinanamountequalto70.00%ofthatexecutive’s
long-termcash bonusbase,and wasissued thenumberofKrogercommonsharesequalto70.00%ofthe
numberofperformanceunitsawardedtothatexecutive,alongwithacashamountequaltothedividendspaid
onthatnumberofcommonsharesduringthethreeyearperformanceperiod.Payoutforthecashcomponents
ofthe2011planarereportedinthe“Non-EquityIncentivePlanCompensation”and“AllOtherCompensation”
columnsoftheSummaryCompensationTableandfootnotes4and6tothattable,andthecommonshares
issuedundertheplanarerepor tedintheOptionsExercisedandStockVestedTableandfootnote2tothattable.