Kroger 2013 Annual Report Download - page 108
Download and view the complete annual report
Please find page 108 of the 2013 Kroger annual report below. You can navigate through the pages in the report by either clicking on the pages listed below, or by using the keyword search tool below to find specific information within the annual report.-
 1
1 -
2
-
3
-
4
-
5
-
6
-
7
-
8
-
9
-
10
-
11
-
12
-
13
-
14
-
15
-
16
-
17
-
18
-
19
-
20
-
21
-
22
-
23
-
24
-
25
-
26
-
27
-
28
-
29
-
30
-
31
-
32
-
33
-
34
-
35
-
36
-
37
-
38
-
39
-
40
-
41
-
42
-
43
-
44
-
45
-
46
-
47
-
48
-
49
-
50
-
51
-
52
-
53
-
54
-
55
-
56
-
57
-
58
-
59
-
60
-
61
-
62
-
63
-
64
-
65
-
66
-
67
-
68
-
69
-
70
-
71
-
72
-
73
-
74
-
75
-
76
-
77
-
78
-
79
-
80
-
81
-
82
-
83
-
84
-
85
-
86
-
87
-
88
-
89
-
90
-
91
-
92
-
93
-
94
-
95
-
96
-
97
-
 98
98 -
 99
99 -
 100
100 -
 101
101 -
 102
102 -
 103
103 -
 104
104 -
 105
105 -
 106
106 -
 107
107 -
 108
108 -
 109
109 -
 110
110 -
 111
111 -
 112
112 -
 113
113 -
 114
114 -
 115
115 -
 116
116 -
 117
117 -
 118
118 -
119
-
120
-
121
-
122
-
123
-
124
-
125
-
126
-
127
-
128
-
129
-
130
-
131
-
132
-
133
-
134
-
135
-
136
-
137
-
138
-
139
-
140
-
141
-
142
-
143
-
144
-
145
-
146
-
147
-
148
-
149
-
150
-
151
-
152
 |
 |

A-35
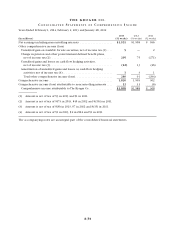
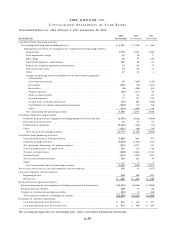
THE KROGER CO.
CO N S O L I D A T E D S T A T E M E N T S O F C A S H F L O W S
Years Ended February 1, 2014, February 2, 2013 and January 28, 2012
(In millions)
2013
(52 weeks)
2012
(53 weeks)
2011
(52 weeks)
Cash Flows From Operating Activities:
Net earnings including noncontrolling interests . . . . . . . . . . . . . . . . . . . . . . . . . . . . . . . . . . $ 1,531 $ 1,508 $ 596
Adjustments to reconcile net earnings to net cash provided by operating activities:
Depreciation. . . . . . . . . . . . . . . . . . . . . . . . . . . . . . . . . . . . . . . . . . . . . . . . . . . . . . . . . . 1,703 1,652 1,638
Asset impairment charge . . . . . . . . . . . . . . . . . . . . . . . . . . . . . . . . . . . . . . . . . . . . . . . . 39 18 37
LIFO charge . . . . . . . . . . . . . . . . . . . . . . . . . . . . . . . . . . . . . . . . . . . . . . . . . . . . . . . . . . 52 55 216
Stock-based employee compensation . . . . . . . . . . . . . . . . . . . . . . . . . . . . . . . . . . . . . . 107 82 81
Expense for Company-sponsored pension plans . . . . . . . . . . . . . . . . . . . . . . . . . . . . . . 74 89 70
Deferred income taxes. . . . . . . . . . . . . . . . . . . . . . . . . . . . . . . . . . . . . . . . . . . . . . . . . . 72 176 31
Other . . . . . . . . . . . . . . . . . . . . . . . . . . . . . . . . . . . . . . . . . . . . . . . . . . . . . . . . . . . . . . . 47 23 3
Changes in operating assets and liabilities net of effects from acquisitions
of businesses:
Store deposits in-transit . . . . . . . . . . . . . . . . . . . . . . . . . . . . . . . . . . . . . . . . . . . . . . . 25 (169) (120)
Inventories . . . . . . . . . . . . . . . . . . . . . . . . . . . . . . . . . . . . . . . . . . . . . . . . . . . . . . . . . (131) (78) (361)
Receivables. . . . . . . . . . . . . . . . . . . . . . . . . . . . . . . . . . . . . . . . . . . . . . . . . . . . . . . . . (8) (126) (63)
Prepaid expenses . . . . . . . . . . . . . . . . . . . . . . . . . . . . . . . . . . . . . . . . . . . . . . . . . . . . (49) (257) 52
Trade accounts payable . . . . . . . . . . . . . . . . . . . . . . . . . . . . . . . . . . . . . . . . . . . . . . . 367 83
Accrued expenses . . . . . . . . . . . . . . . . . . . . . . . . . . . . . . . . . . . . . . . . . . . . . . . . . . . 77 67 215
Income taxes receivable and payable. . . . . . . . . . . . . . . . . . . . . . . . . . . . . . . . . . . . . (47) 164 (106)
Contribution to Company-sponsored pension plans . . . . . . . . . . . . . . . . . . . . . . . . . (100) (71) (52)
Other . . . . . . . . . . . . . . . . . . . . . . . . . . . . . . . . . . . . . . . . . . . . . . . . . . . . . . . . . . . . . (15) (367) 338
Net cash provided by operating activities . . . . . . . . . . . . . . . . . . . . . . . . . . . . . . . . . . . 3,380 2,833 2,658
Cash Flows From Investing Activities:
Payments for property and equipment, including payments for lease buyouts . . . . . . . . . (2,330) (2,062) (1,898)
Proceeds from sale of assets. . . . . . . . . . . . . . . . . . . . . . . . . . . . . . . . . . . . . . . . . . . . . . . . 24 49 51
Payments for acquisitions. . . . . . . . . . . . . . . . . . . . . . . . . . . . . . . . . . . . . . . . . . . . . . . . . . (2,344) (122) (51)
Other . . . . . . . . . . . . . . . . . . . . . . . . . . . . . . . . . . . . . . . . . . . . . . . . . . . . . . . . . . . . . . . . . (121) (48) (10)
Net cash used by investing activities . . . . . . . . . . . . . . . . . . . . . . . . . . . . . . . . . . . . . . . (4,771) (2,183) (1,908)
Cash Flows From Financing Activities:
Proceeds from issuance of long-term debt. . . . . . . . . . . . . . . . . . . . . . . . . . . . . . . . . . . . . 3,548 863 453
Payments on long-term debt . . . . . . . . . . . . . . . . . . . . . . . . . . . . . . . . . . . . . . . . . . . . . . . (1,060) (1,445) (547)
Net (payments) borrowings of commercial paper. . . . . . . . . . . . . . . . . . . . . . . . . . . . . . . (395) 1,275 370
Proceeds from issuance of capital stock . . . . . . . . . . . . . . . . . . . . . . . . . . . . . . . . . . . . . . 196 110 118
Treasury stock purchases . . . . . . . . . . . . . . . . . . . . . . . . . . . . . . . . . . . . . . . . . . . . . . . . . . (609) (1,261) (1,547)
Dividends paid . . . . . . . . . . . . . . . . . . . . . . . . . . . . . . . . . . . . . . . . . . . . . . . . . . . . . . . . . . (319) (267) (257)
Net increase in book overdrafts . . . . . . . . . . . . . . . . . . . . . . . . . . . . . . . . . . . . . . . . . . . . . 193 121 19
Other . . . . . . . . . . . . . . . . . . . . . . . . . . . . . . . . . . . . . . . . . . . . . . . . . . . . . . . . . . . . . . . . . —4 4
Net cash provided (used) by financing activities. . . . . . . . . . . . . . . . . . . . . . . . . . . . . . 1,554 (600) (1,387)
Net increase (decrease) in cash and temporary cash investments . . . . . . . . . . . . . . . . . . . . . . 163 50 (637)
Cash and temporary cash investments:
Beginning of year . . . . . . . . . . . . . . . . . . . . . . . . . . . . . . . . . . . . . . . . . . . . . . . . . . . . . . . . 238 188 825
End of year . . . . . . . . . . . . . . . . . . . . . . . . . . . . . . . . . . . . . . . . . . . . . . . . . . . . . . . . . . . . . $ 401 $ 238 $ 188
Reconciliation of capital investments:
Payments for property and equipment, including payments for lease buyouts . . . . . . . . . . . $(2,330) $(2,062) $(1,898)
Payments for lease buyouts . . . . . . . . . . . . . . . . . . . . . . . . . . . . . . . . . . . . . . . . . . . . . . . . . . 108 73 60
Changes in construction-in-progress payables . . . . . . . . . . . . . . . . . . . . . . . . . . . . . . . . . . . . (83) (1) (60)
Total capital investments, excluding lease buyouts . . . . . . . . . . . . . . . . . . . . . . . . . . . . . . $(2,305) $(1,990) $(1,898)
Disclosure of cash flow information:
Cash paid during the year for interest . . . . . . . . . . . . . . . . . . . . . . . . . . . . . . . . . . . . . . . . $ 401 $ 438 $ 457
Cash paid during the year for income taxes. . . . . . . . . . . . . . . . . . . . . . . . . . . . . . . . . . . . $ 679 $ 468 $ 296
The accompanying notes are an integral part of the consolidated financial statements.