Kroger 2013 Annual Report Download - page 81
Download and view the complete annual report
Please find page 81 of the 2013 Kroger annual report below. You can navigate through the pages in the report by either clicking on the pages listed below, or by using the keyword search tool below to find specific information within the annual report.-
 1
1 -
2
-
3
-
4
-
5
-
6
-
7
-
8
-
9
-
10
-
11
-
12
-
13
-
14
-
15
-
16
-
17
-
18
-
19
-
20
-
21
-
22
-
23
-
24
-
25
-
26
-
27
-
28
-
29
-
30
-
31
-
32
-
33
-
34
-
35
-
36
-
37
-
38
-
39
-
40
-
41
-
42
-
43
-
44
-
45
-
46
-
47
-
48
-
49
-
50
-
51
-
52
-
53
-
54
-
55
-
56
-
57
-
58
-
59
-
60
-
61
-
62
-
63
-
64
-
65
-
66
-
67
-
68
-
69
-
70
-
 71
71 -
 72
72 -
 73
73 -
 74
74 -
 75
75 -
 76
76 -
 77
77 -
 78
78 -
 79
79 -
 80
80 -
 81
81 -
 82
82 -
 83
83 -
 84
84 -
 85
85 -
 86
86 -
 87
87 -
 88
88 -
 89
89 -
 90
90 -
 91
91 -
92
-
93
-
94
-
95
-
96
-
97
-
98
-
99
-
100
-
101
-
102
-
103
-
104
-
105
-
106
-
107
-
108
-
109
-
110
-
111
-
112
-
113
-
114
-
115
-
116
-
117
-
118
-
119
-
120
-
121
-
122
-
123
-
124
-
125
-
126
-
127
-
128
-
129
-
130
-
131
-
132
-
133
-
134
-
135
-
136
-
137
-
138
-
139
-
140
-
141
-
142
-
143
-
144
-
145
-
146
-
147
-
148
-
149
-
150
-
151
-
152
 |
 |
A-8
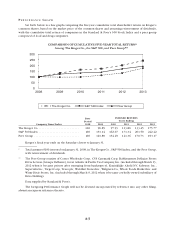
Increasing market share is an important part of our long-term strategy as it best reflects how our products
and services resonate with customers. Market share growth allows us to spread the fixed costs in our business
over a wider revenue base. Our fundamental operating philosophy is to maintain and increase market share
by offering customers good prices and superior products and service. Based on Nielsen POS+ data, our
estimated market share increased in total by approximately 50 basis points in 2013 across our 18 marketing
areas outlined by the Nielsen report. This information also indicates that our market share increased in 16 of
the marketing areas and declined in two. Wal-Mart supercenters are one of our top two competitors in 13 of
these 18 marketing areas. In these 13 marketing areas, our market share increased in 12 and slightly declined
in one. These market share results reflect our long-term strategy of market share growth.
RE S U L T S O F O P E R A T I O N S
The following discussion summarizes our operating results for 2013 compared to 2012 and for 2012
compared to 2011. Comparability is affected by income and expense items that fluctuated significantly
between and among the periods and an extra week in 2012.
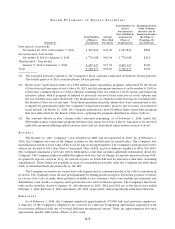
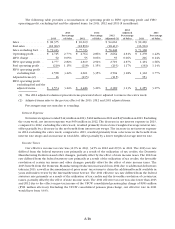
Net Earnings
Net earnings totaled $1.5 billion in 2013, $1.5 billion in 2012 and $602 million in 2011. The net earnings
for 2013 include a net benefit of $23 million, after tax, related to the 2013 adjusted items. The net earnings for
2012 include a benefit from net earnings of approximately $58 million, after-tax, for the extra week and a net
$74 million, after-tax, benefit for the settlement with Visa and MasterCard and a reduction in our obligation to fund
the UFCW consolidated pension fund created in January 2012 (“2012 adjusted items”). The net earnings for 2011
include a UFCW consolidated pension plan charge totaling $591 million, after-tax (“2011 adjusted item”). Excluding
these benefits and charges for adjusted items in 2013, 2012 and 2011, adjusted net earnings were $1.5 billion in
2013, $1.4 billion in 2012 and $1.2 billion in 2011. 2013 adjusted net earnings improved, compared to adjusted net
earnings in 2012, due to an increase in first-in, first-out (“FIFO”) non-fuel operating profit and decreased interest
expense, partially offset by increased income tax expense. 2012 adjusted net earnings improved, compared to
adjusted net earnings in 2011, due to an increase in FIFO non-fuel operating profit, increased net earnings from
our fuel operations and a last-in, first-out (“LIFO”) charge of $55 million (pre-tax), compared to a LIFO charge of
$216 million (pre-tax) in 2011, partially offset by increased interest expense and income tax expense.
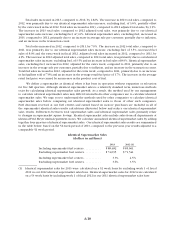
2013 net earnings per diluted share totaled $2.90, and adjusted net earnings per diluted share totaled
$2.85, which excludes the 2013 adjusted items. 2012 net earnings per diluted share totaled $2.77, and adjusted
net earnings per diluted share totaled $2.52, which excludes the 2012 adjusted items. 2011 net earnings per
diluted share totaled $1.01, and adjusted net earnings per diluted share in 2011 totaled $2.00, which excludes
the 2011 adjusted item. Adjusted net earnings per diluted share in 2013, compared to adjusted net earnings
per diluted share in 2012, increased primarily due to fewer shares outstanding as a result of the repurchase
of Kroger common shares, increased FIFO non-fuel operating profit and decreased interest expense, partially
offset by increased income tax expense. Adjusted net earnings per diluted share in 2012, compared to adjusted
net earnings per diluted share in 2011, increased primarily due to fewer shares outstanding as a result of the
repurchase of Kroger common shares, increased FIFO non-fuel operating profit, increased net earnings from
our fuel operations and a decrease in the LIFO charge to $55 million (pre-tax), compared to a LIFO charge of
$216 million (pre-tax) in 2011, partially offset by increased interest expense and income tax expense.
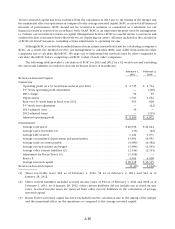
Management believes adjusted net earnings (and adjusted net earnings per diluted share) are useful
metrics to investors and analysts because the adjusted items referenced above in net earnings and net earnings
per diluted share are not directly related to our day-to-day business. Adjusted net earnings (and adjusted net
earnings per diluted share) are non-generally accepted accounting principle (“non-GAAP”) financial measures
and should not be considered alternatives to net earnings (and net earnings per diluted share) or any other
generally accepted accounting principle (“GAAP”) measure of performance. Adjusted net earnings (and
adjusted net earnings per diluted share) should not be reviewed in isolation or considered substitutes for our
financial results as reported in accordance with GAAP. Management uses adjusted net earnings (and adjusted
net earnings per diluted share) as it believes these measures are more meaningful indicators of ongoing
operating performance since, as adjusted, those earnings relate more directly to our day-to-day operations.
Management also uses adjusted net earnings (and adjusted net earnings per diluted share) to measure our
progress against internal budgets and targets. In addition, management takes into account adjusted net
earnings when calculating management incentive programs.