Kroger 2013 Annual Report Download - page 120
Download and view the complete annual report
Please find page 120 of the 2013 Kroger annual report below. You can navigate through the pages in the report by either clicking on the pages listed below, or by using the keyword search tool below to find specific information within the annual report.-
 1
1 -
2
-
3
-
4
-
5
-
6
-
7
-
8
-
9
-
10
-
11
-
12
-
13
-
14
-
15
-
16
-
17
-
18
-
19
-
20
-
21
-
22
-
23
-
24
-
25
-
26
-
27
-
28
-
29
-
30
-
31
-
32
-
33
-
34
-
35
-
36
-
37
-
38
-
39
-
40
-
41
-
42
-
43
-
44
-
45
-
46
-
47
-
48
-
49
-
50
-
51
-
52
-
53
-
54
-
55
-
56
-
57
-
58
-
59
-
60
-
61
-
62
-
63
-
64
-
65
-
66
-
67
-
68
-
69
-
70
-
71
-
72
-
73
-
74
-
75
-
76
-
77
-
78
-
79
-
80
-
81
-
82
-
83
-
84
-
85
-
86
-
87
-
88
-
89
-
90
-
91
-
92
-
93
-
94
-
95
-
96
-
97
-
98
-
99
-
100
-
101
-
102
-
103
-
104
-
105
-
106
-
107
-
108
-
109
-
 110
110 -
 111
111 -
 112
112 -
 113
113 -
 114
114 -
 115
115 -
 116
116 -
 117
117 -
 118
118 -
 119
119 -
 120
120 -
 121
121 -
 122
122 -
 123
123 -
 124
124 -
 125
125 -
 126
126 -
 127
127 -
 128
128 -
 129
129 -
 130
130 -
131
-
132
-
133
-
134
-
135
-
136
-
137
-
138
-
139
-
140
-
141
-
142
-
143
-
144
-
145
-
146
-
147
-
148
-
149
-
150
-
151
-
152
 |
 |

A-47
NO T E S T O C O N S O L I D A T E D F I N A N C I A L S T A T E M E N T S , CO N T I N U E D
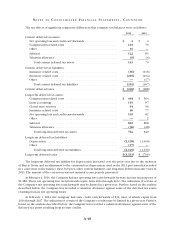
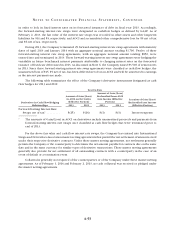
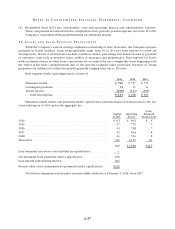
5 . T A X E S B A S E D O N I N C O M E
The provision for taxes based on income consists of:
2013 2012 2011
Federal
Current ................................................ $638 $563 $146
Deferred ............................................... 81 154 78
Subtotal federal ............................................ 719 717 224
State and local
Current ................................................ 42 46 42
Deferred ............................................... (10) 31 (19)
Subtotal state and local ...................................... 32 77 23
Total . . . . . . . . . . . . . . . . . . . . . . . . . . . . . . . . . . . . . . . . . . . . . . . . . . . . . $751 $794 $247
A reconciliation of the statutory federal rate and the effective rate follows:
2013 2012 2011
Statutory rate ........................................... 35.0% 35.0% 35.0%
State income taxes, net of federal tax benefit .................. 0.9% 2.2% 1.8%
Credits ................................................ (1.3)% (1.4)% (3.6)%
Favorable resolution of issues .............................. —(0.5)% (3.4)%
Domestic manufacturing deduction ......................... (1.1)% (0.5)% (1.3)%
Other changes, net....................................... (0.6)% (0.3)% 0.8%
32.9% 34.5% 29.3%
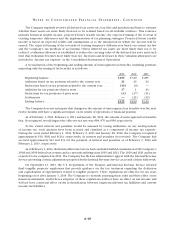
The 2013 tax rate differed from the federal statutory rate primarily as a result of the utilization of tax
credits, the Domestic Manufacturing Deduction and other changes, partially offset by the effect of state
income taxes. The 2013 rate for state income taxes is lower than 2012 and 2011 due to an increase in state
credits, including the benefit from filing amended returns to claim additional credits. The 2013 benefit
from the Domestic Manufacturing Deduction increased from 2012 due to additional deductions taken in
2013, as well as the amendment of prior years’ tax returns to claim the additional benefit available in years
still under review by the Internal Revenue Service. The 2011 effective tax rate was significantly lower than
2013 and 2012 due to the effect on pre-tax income of the UFCW consolidated pension plan charge of $953
($591 after-tax) in 2011. The effect of the UFCW consolidated pension plan charge reduced pre-tax income
thereby increasing the effect of credits and of the favorable resolution of tax issues on our 2011 effective
tax rate.