Kroger 2013 Annual Report Download - page 89
Download and view the complete annual report
Please find page 89 of the 2013 Kroger annual report below. You can navigate through the pages in the report by either clicking on the pages listed below, or by using the keyword search tool below to find specific information within the annual report.-
 1
1 -
2
-
3
-
4
-
5
-
6
-
7
-
8
-
9
-
10
-
11
-
12
-
13
-
14
-
15
-
16
-
17
-
18
-
19
-
20
-
21
-
22
-
23
-
24
-
25
-
26
-
27
-
28
-
29
-
30
-
31
-
32
-
33
-
34
-
35
-
36
-
37
-
38
-
39
-
40
-
41
-
42
-
43
-
44
-
45
-
46
-
47
-
48
-
49
-
50
-
51
-
52
-
53
-
54
-
55
-
56
-
57
-
58
-
59
-
60
-
61
-
62
-
63
-
64
-
65
-
66
-
67
-
68
-
69
-
70
-
71
-
72
-
73
-
74
-
75
-
76
-
77
-
78
-
 79
79 -
 80
80 -
 81
81 -
 82
82 -
 83
83 -
 84
84 -
 85
85 -
 86
86 -
 87
87 -
 88
88 -
 89
89 -
 90
90 -
 91
91 -
 92
92 -
 93
93 -
 94
94 -
 95
95 -
 96
96 -
 97
97 -
 98
98 -
 99
99 -
100
-
101
-
102
-
103
-
104
-
105
-
106
-
107
-
108
-
109
-
110
-
111
-
112
-
113
-
114
-
115
-
116
-
117
-
118
-
119
-
120
-
121
-
122
-
123
-
124
-
125
-
126
-
127
-
128
-
129
-
130
-
131
-
132
-
133
-
134
-
135
-
136
-
137
-
138
-
139
-
140
-
141
-
142
-
143
-
144
-
145
-
146
-
147
-
148
-
149
-
150
-
151
-
152
 |
 |

A-16
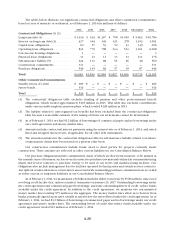
Teeter’s invested capital has been excluded from the calculation in 2013 due to the timing of the merger and
the immaterial effect on operations as compared to the average invested capital. ROIC is a non-GAAP financial
measure of performance. ROIC should not be reviewed in isolation or considered as a substitute for our
financial results as reported in accordance with GAAP. ROIC is an important measure used by management
to evaluate our investment returns on capital. Management believes ROIC is a useful metric to investors and
analysts because it measures how effectively we are deploying our assets. All items included in the calculation
of ROIC are GAAP measures, excluding certain adjustments to operating income.
Although ROIC is a relatively standard financial term, numerous methods exist for calculating a company’s
ROIC. As a result, the method used by our management to calculate ROIC may differ from methods other
companies use to calculate their ROIC. We urge you to understand the methods used by other companies to
calculate their ROIC before comparing our ROIC to that of such other companies.
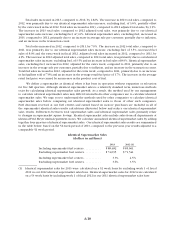
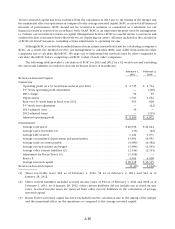
The following table provides a calculation of ROIC for 2013 and 2012 on a 52 week basis and excluding
the assets and liabilities recorded at year end for Harris Teeter ($ in millions):
February 1,
2014
February 2,
2013
Return on Invested Capital
Numerator
Operating profit on a 53 week basis in fiscal year 2012................... $ 2,725 $ 2,764
53rd week operating profit adjustment ................................ — (100)
LIFO charge..................................................... 52 55
Depreciation .................................................... 1,703 1,652
Rent on a 53 week basis in fiscal year 2012 ............................ 613 628
53rd week rent adjustment ......................................... — (12)
2013 adjusted item ............................................... 16 —
2012 adjusted items .............................................. — (115)
Adjusted operating profit .......................................... $ 5,109 $ 4,872
Denominator
Average total assets ............................................... $ 26,958 $ 24,044
Average taxes receivable (1) ........................................ (10) (22)
Average LIFO reserve ............................................. 1,124 1,071
Average accumulated depreciation and amortization..................... 14,991 14,051
Average trade accounts payable ..................................... (4,683) (4,382)
Average accrued salaries and wages .................................. (1,084) (1,061)
Average other current liabilities (2) .................................. (2,544) (2,314)
Adjustment for Harris Teeter (3) ..................................... (1,618) —
Rent x 8........................................................ 4,904 4,928
Average invested capital ........................................... $ 38,038 $ 36,315
Return on Invested Capital ........................................... 13.43% 13.42%
(1) Taxes receivable were $18 as of February 1, 2014, $2 as of February 2, 2013 and $42 as of
January 28, 2012.
(2) Other current liabilities included accrued income taxes of $92 as of February 1, 2014 and $128 as of
February 2, 2013. As of January 28, 2012, other current liabilities did not include any accrued income
taxes. Accrued income taxes are removed from other current liabilities in the calculation of average
invested capital.
(3) Harris Teeter’s invested capital has been excluded from the calculation due to the timing of the merger
and the immaterial effect on the operations as compared to the average invested capital.