Kroger 2013 Annual Report Download - page 86
Download and view the complete annual report
Please find page 86 of the 2013 Kroger annual report below. You can navigate through the pages in the report by either clicking on the pages listed below, or by using the keyword search tool below to find specific information within the annual report.-
 1
1 -
2
-
3
-
4
-
5
-
6
-
7
-
8
-
9
-
10
-
11
-
12
-
13
-
14
-
15
-
16
-
17
-
18
-
19
-
20
-
21
-
22
-
23
-
24
-
25
-
26
-
27
-
28
-
29
-
30
-
31
-
32
-
33
-
34
-
35
-
36
-
37
-
38
-
39
-
40
-
41
-
42
-
43
-
44
-
45
-
46
-
47
-
48
-
49
-
50
-
51
-
52
-
53
-
54
-
55
-
56
-
57
-
58
-
59
-
60
-
61
-
62
-
63
-
64
-
65
-
66
-
67
-
68
-
69
-
70
-
71
-
72
-
73
-
74
-
75
-
 76
76 -
 77
77 -
 78
78 -
 79
79 -
 80
80 -
 81
81 -
 82
82 -
 83
83 -
 84
84 -
 85
85 -
 86
86 -
 87
87 -
 88
88 -
 89
89 -
 90
90 -
 91
91 -
 92
92 -
 93
93 -
 94
94 -
 95
95 -
 96
96 -
97
-
98
-
99
-
100
-
101
-
102
-
103
-
104
-
105
-
106
-
107
-
108
-
109
-
110
-
111
-
112
-
113
-
114
-
115
-
116
-
117
-
118
-
119
-
120
-
121
-
122
-
123
-
124
-
125
-
126
-
127
-
128
-
129
-
130
-
131
-
132
-
133
-
134
-
135
-
136
-
137
-
138
-
139
-
140
-
141
-
142
-
143
-
144
-
145
-
146
-
147
-
148
-
149
-
150
-
151
-
152
 |
 |
A-13
We calculate FIFO operating profit as operating profit excluding the LIFO charge. FIFO operating profit
is a non-GAAP financial measure and should not be considered as an alternative to operating profit or any
other GAAP measure of performance. FIFO operating profit should not be reviewed in isolation or considered
as a substitute for our financial results as reported in accordance with GAAP. FIFO operating profit is an
important measure used by management to evaluate operational effectiveness. Management believes FIFO
operating profit is a useful metric to investors and analysts because it measures our day-to-day operational
effectiveness. Since fuel discounts are earned based on in-store purchases, fuel operating profit does not
include fuel discounts, which are allocated to our in-store supermarket location departments. We also derive
operating, general and administrative expenses, rent and depreciation and amortization through the use of
estimated allocations in the calculation of fuel operating profit.
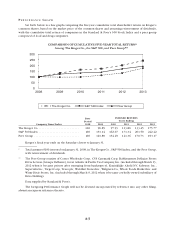
FIFO operating profit was $2.8 billion in 2013 and 2012, and $1.5 billion in 2011. Excluding the extra
week in 2012, FIFO operating profit was $2.7 billion. FIFO operating profit, as a percentage of sales, was
2.82% in 2013, 2.92% in 2012 and 1.66% in 2011. FIFO operating profit, as a percentage of sales excluding the
extra week in 2012, was 2.87%. FIFO operating profit, excluding the 2013, 2012, and 2011 adjusted items, was
$2.8 billion in 2013, $2.6 billion in 2012 and $2.4 billion in 2011. FIFO operating profit, as a percentage of
sales excluding the 2013, 2012, and 2011 adjusted items, was 2.84% in 2013, 2.75% in 2012, and 2.71% in 2011.
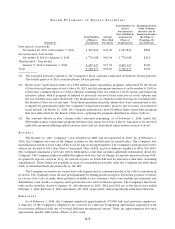
Retail fuel sales lower our overall FIFO operating profit rate due to the very low FIFO operating profit
rate, as a percentage of sales, of retail fuel sales compared to non-fuel sales. FIFO operating profit, excluding
fuel, was $2.6 billion in 2013 and 2012, and $1.3 billion in 2011. Excluding the extra week, FIFO operating
profit, excluding fuel, was $2.5 billion in 2012. FIFO operating profit, as a percentage of sales excluding fuel,
was 3.22% in 2013, 3.35% in 2012, and 1.77% in 2011. Excluding the extra week, FIFO operating profit, as a
percentage of sales excluding fuel, was 3.28% in 2012. FIFO operating profit, excluding fuel and the 2013,
2012 and 2011 adjusted items, was $2.6 billion in 2013, $2.4 billion in 2012 and $2.3 billion in 2011. FIFO
operating profit, as a percentage of sales excluding fuel and the 2013, 2012, and 2011 adjusted items, was
3.24% in 2013, 3.13% in 2012 and 3.07% in 2011.
Excluding fuel, FIFO operating profit, as a percentage of sales excluding the 2013 and 2012 adjusted items,
increased 11 basis points in 2013, compared to 2012, primarily due to improvements in OG&A expenses, rent
and depreciation, as a percentage of sales, offset partially by continued investments in lower prices for our
customers and increased shrink and advertising costs, as a percentage of sales. Excluding fuel, FIFO operating
profit, as a percentage of sales excluding the 2012 and 2011 adjusted items, increased six basis points in 2012,
compared to 2011, primarily due to improvements in operating, general and administrative expenses, rent
and depreciation, as a percentage of sales, offset partially by continued investments in lower prices for our
customers and increased shrink and warehousing costs, as a percentage of sales.