Kroger 2013 Annual Report Download - page 139
Download and view the complete annual report
Please find page 139 of the 2013 Kroger annual report below. You can navigate through the pages in the report by either clicking on the pages listed below, or by using the keyword search tool below to find specific information within the annual report.-
 1
1 -
2
-
3
-
4
-
5
-
6
-
7
-
8
-
9
-
10
-
11
-
12
-
13
-
14
-
15
-
16
-
17
-
18
-
19
-
20
-
21
-
22
-
23
-
24
-
25
-
26
-
27
-
28
-
29
-
30
-
31
-
32
-
33
-
34
-
35
-
36
-
37
-
38
-
39
-
40
-
41
-
42
-
43
-
44
-
45
-
46
-
47
-
48
-
49
-
50
-
51
-
52
-
53
-
54
-
55
-
56
-
57
-
58
-
59
-
60
-
61
-
62
-
63
-
64
-
65
-
66
-
67
-
68
-
69
-
70
-
71
-
72
-
73
-
74
-
75
-
76
-
77
-
78
-
79
-
80
-
81
-
82
-
83
-
84
-
85
-
86
-
87
-
88
-
89
-
90
-
91
-
92
-
93
-
94
-
95
-
96
-
97
-
98
-
99
-
100
-
101
-
102
-
103
-
104
-
105
-
106
-
107
-
108
-
109
-
110
-
111
-
112
-
113
-
114
-
115
-
116
-
117
-
118
-
119
-
120
-
121
-
122
-
123
-
124
-
125
-
126
-
127
-
128
-
 129
129 -
 130
130 -
 131
131 -
 132
132 -
 133
133 -
 134
134 -
 135
135 -
 136
136 -
 137
137 -
 138
138 -
 139
139 -
 140
140 -
 141
141 -
 142
142 -
 143
143 -
 144
144 -
 145
145 -
 146
146 -
 147
147 -
 148
148 -
 149
149 -
150
-
151
-
152
 |
 |

A-66
NO T E S T O C O N S O L I D A T E D F I N A N C I A L S T A T E M E N T S , CO N T I N U E D
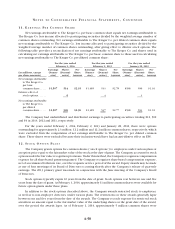
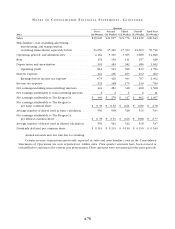
The Company uses the RP-2000 projected 2021 mortality table in calculating the pension obligation.
Pension Benefits
Qualified Plans Non-Qualified Plan Other Benefits
2013 2012 2011 2013 2012 2011 2013 2012 2011
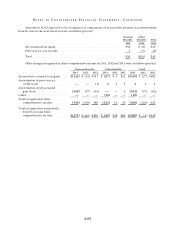
Components of net periodic benefit cost:
Service cost......................... $ 40 $ 44 $ 41 $ 3 $ 3 $ 3 $17 $16 $13
Interest cost ........................ 144 146 158 99 10 15 16 17
Expected return on plan assets.......... (224) (210) (207) —— — —— —
Amortization of:
Prior service cost (credit) ........... —— — —— 1 (4) (4) (5)
Actuarial (gain) loss ................ 93 88 57 99 7 —— (2)
Net periodic benefit cost ................. $ 53 $ 68 $ 49 $21 $21 $21 $28 $28 $23
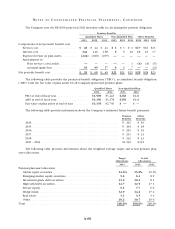
The following table provides the projected benefit obligation (“PBO”), accumulated benefit obligation
(“ABO”) and the fair value of plan assets for all Company-sponsored pension plans.
Qualified Plans Non-Qualified Plan
2013 2012 2013 2012
PBO at end of fiscal year .................... $3,509 $3,443 $263 $221
ABO at end of fiscal year .................... $3,360 $3,278 $256 $211
Fair value of plan assets at end of year ......... $3,135 $2,746 $ — $ —
The following table provides information about the Company’s estimated future benefit payments.
Pension
Benefits
Other
Benefits
2014 ....................................................... $ 201 $ 16
2015 ....................................................... $ 204 $ 18
2016 ....................................................... $ 203 $ 19
2017 ....................................................... $ 211 $ 21
2018 ....................................................... $ 221 $ 23
2019 – 2023 ................................................. $1,232 $135
The following table provides information about the weighted average target and actual pension plan
asset allocations.
Target
allocations
Actual
Allocations
2013 2013 2012
Pension plan asset allocation
Global equity securities ..................................... 14.6% 15.0% 19.2%
Emerging market equity securities ............................. 5.6 6.2 8.9
Investment grade debt securities .............................. 11.6 10.4 8.1
High yield debt securities .................................... 12.7 12.5 17.3
Private equity ............................................. 9.1 7.7 6.0
Hedge funds .............................................. 32.9 34.2 27.2
Real estate ................................................ 3.3 3.3 3.3
Other.................................................... 10.2 10.7 10.0
Total . . . . . . . . . . . . . . . . . . . . . . . . . . . . . . . . . . . . . . . . . . . . . . . . . . . . . . . 100.0% 100.0% 100.0%