Kroger 2013 Annual Report Download - page 82
Download and view the complete annual report
Please find page 82 of the 2013 Kroger annual report below. You can navigate through the pages in the report by either clicking on the pages listed below, or by using the keyword search tool below to find specific information within the annual report.-
 1
1 -
2
-
3
-
4
-
5
-
6
-
7
-
8
-
9
-
10
-
11
-
12
-
13
-
14
-
15
-
16
-
17
-
18
-
19
-
20
-
21
-
22
-
23
-
24
-
25
-
26
-
27
-
28
-
29
-
30
-
31
-
32
-
33
-
34
-
35
-
36
-
37
-
38
-
39
-
40
-
41
-
42
-
43
-
44
-
45
-
46
-
47
-
48
-
49
-
50
-
51
-
52
-
53
-
54
-
55
-
56
-
57
-
58
-
59
-
60
-
61
-
62
-
63
-
64
-
65
-
66
-
67
-
68
-
69
-
70
-
71
-
 72
72 -
 73
73 -
 74
74 -
 75
75 -
 76
76 -
 77
77 -
 78
78 -
 79
79 -
 80
80 -
 81
81 -
 82
82 -
 83
83 -
 84
84 -
 85
85 -
 86
86 -
 87
87 -
 88
88 -
 89
89 -
 90
90 -
 91
91 -
 92
92 -
93
-
94
-
95
-
96
-
97
-
98
-
99
-
100
-
101
-
102
-
103
-
104
-
105
-
106
-
107
-
108
-
109
-
110
-
111
-
112
-
113
-
114
-
115
-
116
-
117
-
118
-
119
-
120
-
121
-
122
-
123
-
124
-
125
-
126
-
127
-
128
-
129
-
130
-
131
-
132
-
133
-
134
-
135
-
136
-
137
-
138
-
139
-
140
-
141
-
142
-
143
-
144
-
145
-
146
-
147
-
148
-
149
-
150
-
151
-
152
 |
 |

A-9
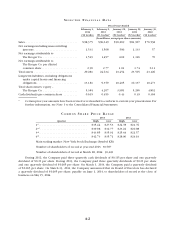
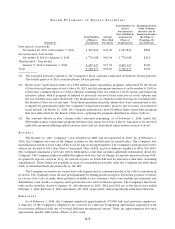
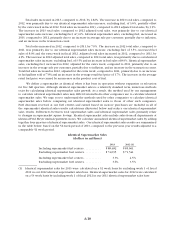
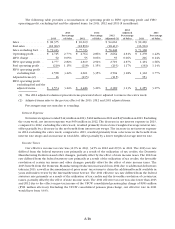
The following table provides a reconciliation of net earnings attributable to The Kroger Co. to net
earnings attributable to The Kroger Co. excluding the adjusted items and a reconciliation of net earnings
attributable to The Kroger Co. per diluted common share to the net earnings attributable to The Kroger Co.
per diluted common share excluding the adjusted items, for 2013, 2012 and 2011:
Net Earnings per Diluted Share excluding the Adjustment Items
(in millions, except per share amounts)
2013 2012 2011
Net earnings attributable to The Kroger Co. .......................... $1,519 $1,497 $ 602
Benefit from certain tax items offset by Harris Teeter merger costs (1) ..... (23) — —
53rd week adjustment (1) .......................................... — (58) —
Adjustment for the UFCW consolidated pension plan liability and
credit card settlement (1) ...................................... — (74) —
UFCW pension plan consolidation charge (1) ......................... — — 591
Net earnings attributable to The Kroger Co. excluding the adjustment
items above ................................................. $1,496 $1,365 $1,193
Net Earnings attributable to The Kroger Co. per diluted common share .... $ 2.90 $ 2.77 $ 1.01
Benefit from certain tax items offset by Harris Teeter merger costs (2) ..... (0.05) — —
53rd week adjustment (2) ......................................... — (0.11) —
Adjustments for the UFCW consolidated pension plan liability and
credit card settlement (2) ...................................... — (0.14) —
UFCW pension plan consolidation charge (2) ......................... — — 0.99
Net earnings attributable to The Kroger Co. per diluted common
share excluding the adjustment items above ....................... $ 2.85 $ 2.52 $ 2.00
Average numbers of common shares used in diluted calculation .......... 520 537 593
(1) The amounts presented represent the after-tax effect of each adjustment. Pre-tax amounts were $27 for
Harris Teeter merger costs in 2013, $91 for the 53rd week adjustment in 2012, $115 for the adjustment for
the UFCW consolidated pension plan liability and credit card settlement in 2012 and $953 for the UFCW
pension plan consolidation charge in 2011.
(2) The amounts presented represent the net earnings per diluted common share effect of each adjustment.
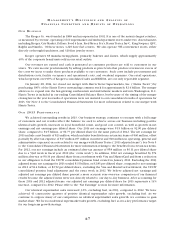
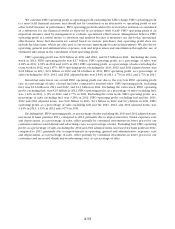
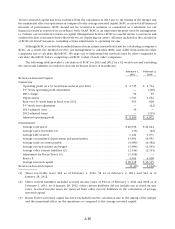
Sales
Total Sales
(in millions)
2013
Percentage
Increase (2) 2012
2012
Adjusted (3)
Percentage
Increase (4) 2011
Total supermarket sales
without fuel . . . . . . . . . . . . . . . . . . . $ 76,666 4.0% $75,179 $ 73,733 3.8% $71,004
Fuel sales . . . . . . . . . . . . . . . . . . . . . . . . 18,962 3.0% 18,896 18,413 8.9% 16,901
Other sales (1) . . . . . . . . . . . . . . . . . . . . 2,747 9.2% 2,544 2,515 6.4% 2,364
Total sales . . . . . . . . . . . . . . . . . . . . . . . $ 98,375 3.9% $96,619 $94,661 4.9% $90,269
(1) Other sales primarily relate to sales at convenience stores, excluding fuel; jewelry stores; manufacturing
plants to outside customers; variable interest entities; a specialty pharmacy; and in-store health clinics.
(2) This column represents the percentage increase in 2013, compared to adjusted sales in 2012.
(3) The 2012 adjusted column represents the items presented in the 2012 column as adjusted to remove the
extra week.
(4) This column represents the percentage increase in adjusted sales in 2012, compared to 2011.