Kraft 2007 Annual Report Download - page 95
Download and view the complete annual report
Please find page 95 of the 2007 Kraft annual report below. You can navigate through the pages in the report by either clicking on the pages listed below, or by using the keyword search tool below to find specific information within the annual report.-
 1
1 -
2
-
3
-
4
-
5
-
6
-
7
-
8
-
9
-
10
-
11
-
12
-
13
-
14
-
15
-
16
-
17
-
18
-
19
-
20
-
21
-
22
-
23
-
24
-
25
-
26
-
27
-
28
-
29
-
30
-
31
-
32
-
33
-
34
-
35
-
36
-
37
-
38
-
39
-
40
-
41
-
42
-
43
-
44
-
45
-
46
-
47
-
48
-
49
-
50
-
51
-
52
-
53
-
54
-
55
-
56
-
57
-
58
-
59
-
60
-
61
-
62
-
63
-
64
-
65
-
66
-
67
-
68
-
69
-
70
-
71
-
72
-
73
-
74
-
75
-
76
-
77
-
78
-
79
-
80
-
81
-
82
-
83
-
84
-
 85
85 -
 86
86 -
 87
87 -
 88
88 -
 89
89 -
 90
90 -
 91
91 -
 92
92 -
 93
93 -
 94
94 -
 95
95 -
 96
96 -
 97
97 -
 98
98 -
 99
99 -
 100
100 -
 101
101 -
 102
102 -
 103
103 -
 104
104 -
 105
105 -
106
-
107
-
108
 |
 |

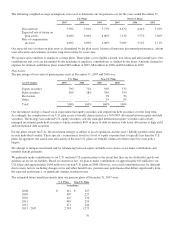
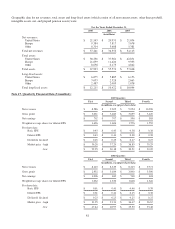
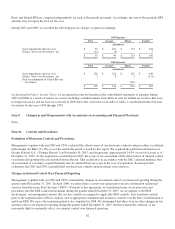
For the Year Ended December 31, 2005
Kraft North
America
Kraft
International Total
(in millions)
Consumer Sector:
Snacks $ 5,372 $ 4,161 $ 9,533
Beverages 3,320 3,840 7,160
Cheese 4,952 1,568 6,520
Grocery 4,613 876 5,489
Convenient Meals 5,036 375 5,411
Total net revenues $ 23,293 $ 10,820 $ 34,113
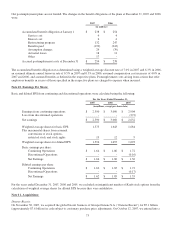
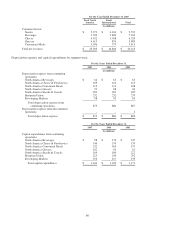
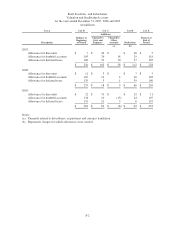
Depreciation expense and capital expenditures by segment were:
For the Years Ended December 31,
2007 2006 2005
(in millions)
Depreciation expense from continuing
operations:
North America Beverages $ 62 $ 65 $ 65
North America Cheese & Foodservice 109 110 113
North America Convenient Meals 119 112 108
North America Grocery 52 68 60
North America Snacks & Cereals 201 202 205
European Union 232 232 233
Developing Markets 98 95 83
Total depreciation expense from
continuing operations 873 884 867
Depreciation expense from discontinued
operations - - 2
Total depreciation expense $ 873 $ 884 $ 869
For the Years Ended December 31,
2007 2006 2005
(in millions)
Capital expenditures from continuing
operations:
North America Beverages $ 98 $ 179 $ 147
North America Cheese & Foodservice 144 139 133
North America Convenient Meals 232 169 137
North America Grocery 102 65 81
North America Snacks & Cereals 184 160 222
European Union 225 240 292
Developing Markets 256 217 159
Total capital expenditures $ 1,241 $ 1,169 $ 1,171
80