Kraft 2007 Annual Report Download - page 13
Download and view the complete annual report
Please find page 13 of the 2007 Kraft annual report below. You can navigate through the pages in the report by either clicking on the pages listed below, or by using the keyword search tool below to find specific information within the annual report.-
 1
1 -
2
-
 3
3 -
 4
4 -
 5
5 -
 6
6 -
 7
7 -
 8
8 -
 9
9 -
 10
10 -
 11
11 -
 12
12 -
 13
13 -
 14
14 -
 15
15 -
 16
16 -
 17
17 -
 18
18 -
 19
19 -
 20
20 -
 21
21 -
 22
22 -
 23
23 -
24
-
25
-
26
-
27
-
28
-
29
-
30
-
31
-
32
-
33
-
34
-
35
-
36
-
37
-
38
-
39
-
40
-
41
-
42
-
43
-
44
-
45
-
46
-
47
-
48
-
49
-
50
-
51
-
52
-
53
-
54
-
55
-
56
-
57
-
58
-
59
-
60
-
61
-
62
-
63
-
64
-
65
-
66
-
67
-
68
-
69
-
70
-
71
-
72
-
73
-
74
-
75
-
76
-
77
-
78
-
79
-
80
-
81
-
82
-
83
-
84
-
85
-
86
-
87
-
88
-
89
-
90
-
91
-
92
-
93
-
94
-
95
-
96
-
97
-
98
-
99
-
100
-
101
-
102
-
103
-
104
-
105
-
106
-
107
-
108
 |
 |

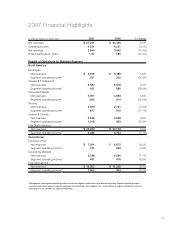
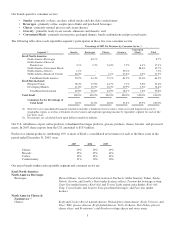
* Management uses segment operating income to evaluate segment performance and allocate resources. Segment operating income
excludes unallocated general corporate expenses and amortization of intangibles. For a reconciliation of segment operating income to
operating income, see Note 16,
Segment Reporting
.
2007 Financial Highlights
(in millions, except per share data) 2007 2006 % Change
Net revenues $ 37,241 $ 34,356 8.4%
Operating income 4,331 4,521 (4.2%)
Net earnings 2,590 3,060 (15.4%)
Diluted earnings per share 1.62 1.85 (12.4%)
Results of Operations by Business Segment
North America
Beverages
Net revenues $ 3,235 $ 3,088 4.8%
Segment operating income* 337 205 64.4%
Cheese & Foodservice
Net revenues 6,382 6,078 5.0%
Segment operating income* 621 886 (29.9%)
Convenient Meals
Net revenues 5,097 4,863 4.8%
Segment operating income* 695 914 (24.0%)
Grocery
Net revenues 2,699 2,731 (1.2%)
Segment operating income* 817 919 (11.1%)
Snacks & Cereals
Net revenues 6,526 6,358 2.6%
Segment operating income* 1,018 829 22.8%
Total North America
Net revenues $ 23,939 $ 23,118 3.6%
Segment operating income* 3,488 3,753 (7.1%)
International
European Union
Net revenues $ 7,954 $ 6,672 19.2%
Segment operating income* 571 548 4.2%
Developing Markets
Net revenues 5,348 4,566 17.1%
Segment operating income* 491 416 18.0%
Total International
Net revenues $ 13,302 $ 11,238 18.4%
Segment operating income* 1,062 964 10.2%
11