Kraft 2007 Annual Report Download - page 84
Download and view the complete annual report
Please find page 84 of the 2007 Kraft annual report below. You can navigate through the pages in the report by either clicking on the pages listed below, or by using the keyword search tool below to find specific information within the annual report.-
 1
1 -
2
-
3
-
4
-
5
-
6
-
7
-
8
-
9
-
10
-
11
-
12
-
13
-
14
-
15
-
16
-
17
-
18
-
19
-
20
-
21
-
22
-
23
-
24
-
25
-
26
-
27
-
28
-
29
-
30
-
31
-
32
-
33
-
34
-
35
-
36
-
37
-
38
-
39
-
40
-
41
-
42
-
43
-
44
-
45
-
46
-
47
-
48
-
49
-
50
-
51
-
52
-
53
-
54
-
55
-
56
-
57
-
58
-
59
-
60
-
61
-
62
-
63
-
64
-
65
-
66
-
67
-
68
-
69
-
70
-
71
-
72
-
73
-
 74
74 -
 75
75 -
 76
76 -
 77
77 -
 78
78 -
 79
79 -
 80
80 -
 81
81 -
 82
82 -
 83
83 -
 84
84 -
 85
85 -
 86
86 -
 87
87 -
 88
88 -
 89
89 -
 90
90 -
 91
91 -
 92
92 -
 93
93 -
 94
94 -
95
-
96
-
97
-
98
-
99
-
100
-
101
-
102
-
103
-
104
-
105
-
106
-
107
-
108
 |
 |

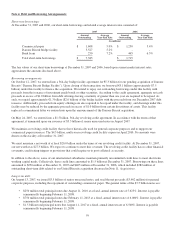
Included in the tables above are our U.S. and non-U.S. plans with accumulated benefit obligations in excess of plan assets. The
majority of these U.S. plans are for salaried employees that cannot be funded under IRS regulations. The projected benefit
obligations, accumulated benefit obligations and the fair value of plan assets at December 31, 2007 and 2006 were:
U.S. Plans Non-U.S. Plans
2007 2006 2007 2006
(in millions)
Projected benefit obligation $ 203 $ 247 $ 1,470 $ 1,364
Accumulated benefit obligation 180 196 1,378 1,281
Fair value of plan assets - 11 771 646
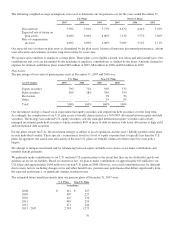
The following weighted-average assumptions were used to determine our benefit obligations under the plans at December 31:
U.S. Plans Non-U.S. Plans
2007 2006 2007 2006
Discount rate 6.30% 5.90% 5.44% 4.67%
Rate of compensation increase 4.00% 4.00% 3.13% 3.00%
Our 2007 year-end U.S. and Canadian plans discount rates were developed from a model portfolio of high quality, fixed-income
debt instruments with durations that match the expected future cash flows of the benefit obligations. The 2007 year-end discount
rates for our non-U.S. plans (other than Canadian pension plans) were developed from local bond indices that match local
benefit obligations as closely as possible.
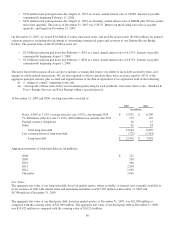
Components of Net Periodic Pension Cost:
Net periodic pension cost consisted of the following for the years ended December 31, 2007, 2006 and 2005:
U.S. Plans Non-U.S. Plans
2007 2006 2005 2007 2006 2005
(in millions)
Service cost $ 159 $ 170 $ 165 $ 101 $ 95 $ 80
Interest cost 365 354 345 194 169 170
Expected return on plan assets (523) (504) (507) (251) (203) (190)
Amortization:
Net loss from experience
differences 138 198 166 66 73 47
Prior service cost 5549 8 8
Other expense 68 66 83 4 13 25
Net pension cost $ 212 $ 289 $ 256 $ 123 $ 155 $ 140
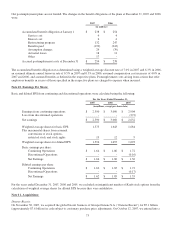
Employees left Kraft under workforce reduction programs, resulting in settlement losses for the U.S. plans of $21 million in
2007, $17 million in 2006 and $10 million in 2005. In addition, retiring employees elected lump-sum payments, resulting in
settlement losses of $47 million in 2007, $49 million in 2006 and $73 million in 2005. Non-U.S. plant closures and early
retirement benefits resulted in curtailment and settlement losses of $4 million in 2007, $13 million in 2006 and $25 million in
2005. These costs are included in other expense, above.
The estimated net loss for the combined U.S. and non-U.S. pension plans that is expected to be amortized from accumulated
other comprehensive losses into net periodic pension cost during 2008 is $115 million. The estimated prior service cost for the
combined U.S. and non-U.S. pension plans that is expected to be amortized from accumulated other comprehensive losses into
net periodic pension cost during 2008 is $14 million.
69