Kraft 2007 Annual Report Download - page 42
Download and view the complete annual report
Please find page 42 of the 2007 Kraft annual report below. You can navigate through the pages in the report by either clicking on the pages listed below, or by using the keyword search tool below to find specific information within the annual report.-
 1
1 -
2
-
3
-
4
-
5
-
6
-
7
-
8
-
9
-
10
-
11
-
12
-
13
-
14
-
15
-
16
-
17
-
18
-
19
-
20
-
21
-
22
-
23
-
24
-
25
-
26
-
27
-
28
-
29
-
30
-
31
-
 32
32 -
 33
33 -
 34
34 -
 35
35 -
 36
36 -
 37
37 -
 38
38 -
 39
39 -
 40
40 -
 41
41 -
 42
42 -
 43
43 -
 44
44 -
 45
45 -
 46
46 -
 47
47 -
 48
48 -
 49
49 -
 50
50 -
 51
51 -
 52
52 -
53
-
54
-
55
-
56
-
57
-
58
-
59
-
60
-
61
-
62
-
63
-
64
-
65
-
66
-
67
-
68
-
69
-
70
-
71
-
72
-
73
-
74
-
75
-
76
-
77
-
78
-
79
-
80
-
81
-
82
-
83
-
84
-
85
-
86
-
87
-
88
-
89
-
90
-
91
-
92
-
93
-
94
-
95
-
96
-
97
-
98
-
99
-
100
-
101
-
102
-
103
-
104
-
105
-
106
-
107
-
108
 |
 |

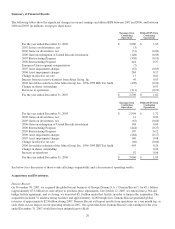
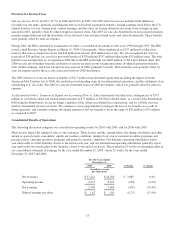
The following discussion compares our operating results for each of our reportable segments for 2007 with 2006, and for 2006
with 2005.
For the Years Ended
December 31,
2007 2006 2005
(in millions)
Net revenues:
North America Beverages $ 3,235 $ 3,088 $ 3,056
North America Cheese & Foodservice 6,382 6,078 6,244
North America Convenient Meals 5,097 4,863 4,719
North America Grocery 2,699 2,731 3,024
North America Snacks & Cereals 6,526 6,358 6,250
European Union 7,954 6,672 6,714
Developing Markets 5,348 4,566 4,106
Net revenues $ 37,241 $ 34,356 $ 34,113
For the Years Ended
December 31,
2007 2006 2005
(in millions)
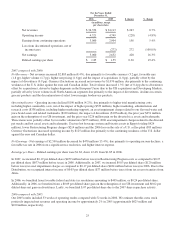
Operating income:
Segment operating income:
North America Beverages $ 337 $ 205 $ 463
North America Cheese & Foodservice 621 886 921
North America Convenient Meals 695 914 793
North America Grocery 817 919 724
North America Snacks & Cereals 1,018 829 930
European Union 571 548 722
Developing Markets 491 416 400
General corporate expenses (206) (189) (194)
Amortization of intangibles (13) (7) (10)
Operating income $ 4,331 $ 4,521 $ 4,749
As discussed in Note 16 to the consolidated financial statements, Segment Reporting, our management uses segment operating
income to evaluate segment performance and allocate resources. Segment operating income excludes unallocated general
corporate expenses and amortization of intangibles. Management believes it is appropriate to disclose this measure to help
investors analyze segment performance and trends. We incurred asset impairment, exit and implementation costs of $579
million in 2007, $1,097 million in 2006 and $566 million in 2005. Refer to Note 2, Asset Impairment, Exit and Implementation
Costs, for a breakout of charges by segment.
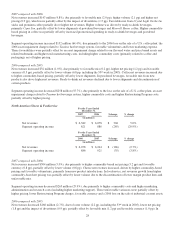
North America Beverages For the Years Ended
December 31,
$ change % change2007 2006
(in millions)
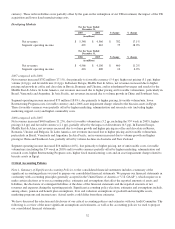
Net revenues $ 3,235 $ 3,088 $ 147 4.8%
Segment operating income 337 205 132 64.4%
For the Years Ended
December 31,
$ change % change2006 2005
(in millions)
Net revenues $ 3,088 $ 3,056 $ 32 1.0%
Segment operating income 205 463 (258) (55.7%)
27