Kraft 2007 Annual Report Download - page 40
Download and view the complete annual report
Please find page 40 of the 2007 Kraft annual report below. You can navigate through the pages in the report by either clicking on the pages listed below, or by using the keyword search tool below to find specific information within the annual report.-
 1
1 -
2
-
3
-
4
-
5
-
6
-
7
-
8
-
9
-
10
-
11
-
12
-
13
-
14
-
15
-
16
-
17
-
18
-
19
-
20
-
21
-
22
-
23
-
24
-
25
-
26
-
27
-
28
-
29
-
 30
30 -
 31
31 -
 32
32 -
 33
33 -
 34
34 -
 35
35 -
 36
36 -
 37
37 -
 38
38 -
 39
39 -
 40
40 -
 41
41 -
 42
42 -
 43
43 -
 44
44 -
 45
45 -
 46
46 -
 47
47 -
 48
48 -
 49
49 -
 50
50 -
51
-
52
-
53
-
54
-
55
-
56
-
57
-
58
-
59
-
60
-
61
-
62
-
63
-
64
-
65
-
66
-
67
-
68
-
69
-
70
-
71
-
72
-
73
-
74
-
75
-
76
-
77
-
78
-
79
-
80
-
81
-
82
-
83
-
84
-
85
-
86
-
87
-
88
-
89
-
90
-
91
-
92
-
93
-
94
-
95
-
96
-
97
-
98
-
99
-
100
-
101
-
102
-
103
-
104
-
105
-
106
-
107
-
108
 |
 |

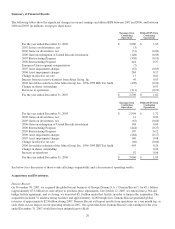
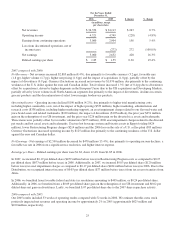
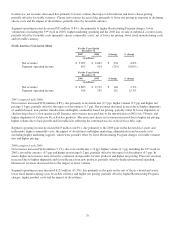
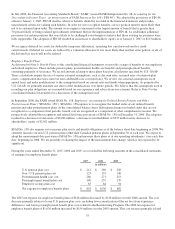
For the Years Ended
December 31,
$ change % change2006 2005
(in millions, except
per share data)
Net revenues $ 34,356 $ 34,113 $ 243 0.7%
Operating income 4,521 4,749 (228) (4.8%)
Earnings from continuing operations 3,060 2,904 156 5.4%
Loss from discontinued operations, net of
income taxes - (272) 272 (100.0%)
Net earnings 3,060 2,632 428 16.3%
Diluted earnings per share $ 1.85 $ 1.55 0.30 19.4%
2007 compared with 2006:
Net Revenues - Net revenues increased $2,885 million (8.4%), due primarily to favorable currency (3.2 pp), favorable mix
(1.8 pp), higher volume (1.7 pp), higher net pricing (1.6 pp) and the impact of acquisitions (1.0 pp), partially offset by the
impact of divestitures (0.9 pp). Currency fluctuations increased net revenues by $1,070 million, due primarily to the continuing
weakness of the U.S. dollar against the euro and Canadian dollar. Total volume increased 1.3% (net of 0.4 pp due to divestitures
offset by acquisitions), driven by higher shipments in the European Union (due to the UB acquisition) and Developing Markets,
partially offset by lower volume in all North American segments due primarily to the impact of divestitures, declines in certain
grocery products and the discontinuation of select lower margin foodservice products.
Operating Income - Operating income declined $190 million (4.2%), due primarily to higher total manufacturing costs,
including higher commodity costs, net of the impact of higher pricing ($533 million), higher marketing, administration and
research costs ($338 million, including higher marketing support), an asset impairment charge related to our flavored water and
juice brand assets and related trademarks ($120 million), the impact of divestitures ($105 million), the prior year $251 million
gain on the redemption of our UB investment, and the prior year $226 million gain on the divested rice assets and trademarks.
These items were partially offset by favorable volume/mix ($475 million), 2006 asset impairment charges related to the divested
pet snacks and hot cereal assets and trademarks, Tassimo hot beverage system and biscuits assets in Egypt (totaling $424
million), lower Restructuring Program charges ($214 million) and the 2006 loss on the sale of a U.S. coffee plant ($95 million).
Currency fluctuations increased operating income by $125 million due primarily to the continuing weakness of the U.S. dollar
against the euro and Canadian dollar.
Net Earnings - Net earnings of $2,590 million decreased by $470 million (15.4%), due primarily to operating income declines, a
favorable tax rate in 2006 from a significant tax resolution, and higher interest expense.
Earnings per Share - Diluted earnings per share were $1.62, down 12.4% from $1.85 in 2006.
In 2007, we incurred $0.19 per diluted share ($459 million before taxes) in Restructuring Program costs as compared to $0.27
per diluted share ($673 million before taxes) in 2006. Additionally, in 2007, we incurred $0.03 per diluted share ($120 million
before taxes) in asset impairment charges as compared to $0.17 per diluted share ($424 million before taxes) in 2006. Due to the
Distribution, we recognized interest income of $0.03 per diluted share ($77 million before taxes) from tax reserve transfers from
Altria.
In 2006, we benefited from favorable federal and state tax resolutions amounting to $405 million, or $0.24 per diluted share.
Additionally, in 2006, we benefited from a $0.09 per diluted share gain on the redemption of our UB investment and $0.02 per
diluted share net gain on divestitures. Lastly, we benefited $.07 per diluted share due to the 2007 share repurchase activity.
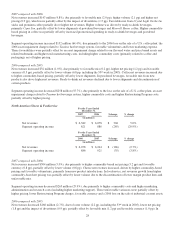
2006 compared with 2005:
Our 2005 results included 53 weeks of operating results compared with 52 weeks in 2006. We estimate that this extra week
positively impacted net revenues and operating income by approximately 2% in 2005 (approximately $625 million and
$100 million, respectively).
25