Kraft 2007 Annual Report Download - page 45
Download and view the complete annual report
Please find page 45 of the 2007 Kraft annual report below. You can navigate through the pages in the report by either clicking on the pages listed below, or by using the keyword search tool below to find specific information within the annual report.-
 1
1 -
2
-
3
-
4
-
5
-
6
-
7
-
8
-
9
-
10
-
11
-
12
-
13
-
14
-
15
-
16
-
17
-
18
-
19
-
20
-
21
-
22
-
23
-
24
-
25
-
26
-
27
-
28
-
29
-
30
-
31
-
32
-
33
-
34
-
 35
35 -
 36
36 -
 37
37 -
 38
38 -
 39
39 -
 40
40 -
 41
41 -
 42
42 -
 43
43 -
 44
44 -
 45
45 -
 46
46 -
 47
47 -
 48
48 -
 49
49 -
 50
50 -
 51
51 -
 52
52 -
 53
53 -
 54
54 -
 55
55 -
56
-
57
-
58
-
59
-
60
-
61
-
62
-
63
-
64
-
65
-
66
-
67
-
68
-
69
-
70
-
71
-
72
-
73
-
74
-
75
-
76
-
77
-
78
-
79
-
80
-
81
-
82
-
83
-
84
-
85
-
86
-
87
-
88
-
89
-
90
-
91
-
92
-
93
-
94
-
95
-
96
-
97
-
98
-
99
-
100
-
101
-
102
-
103
-
104
-
105
-
106
-
107
-
108
 |
 |

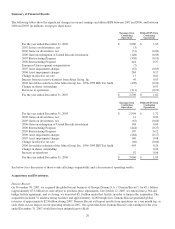
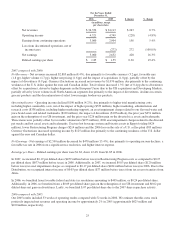
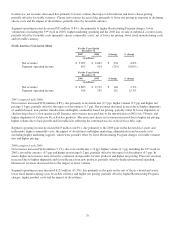
North America Grocery For the Years Ended
December 31,
$ change % change2007 2006
(in millions)
Net revenues $ 2,699 $ 2,731 $ (32) (1.2%)
Segment operating income 817 919 (102) (11.1%)
For the Years Ended
December 31,
$ change % change2006 2005
(in millions)
Net revenues $ 2,731 $ 3,024 $ (293) (9.7%)
Segment operating income 919 724 195 26.9%
2007 compared with 2006:
Net revenues decreased $32 million (1.2%), due primarily to lower volume (1.8 pp) and unfavorable mix (0.8 pp), partially
offset by higher net pricing (1.1 pp) and favorable currency (0.6 pp). The impact of lower shipments in spoonable and pourable
salad dressings, barbeque sauce and dry packaged desserts was partially offset by higher net pricing in spoonable salad
dressings and dry packaged desserts.
Segment operating income decreased $102 million (11.1%), due primarily to higher commodity costs, higher Restructuring
Program costs and unfavorable volume/mix, partially offset by higher pricing.
2006 compared with 2005:
Net revenues decreased $293 million (9.7%), due to the impact of divestitures (8.6 pp) and lower volume (3.6 pp, including the
53rd week in 2005), partially offset by higher pricing (1.1 pp), favorable currency (0.9 pp) and favorable mix (0.5 pp).
Ready-to-eat and dry packaged desserts net revenues declined due to lower shipment volume. In spoonable salad dressing, net
revenues decreased due to lower shipments, partially offset by lower promotional spending. Pourable salad dressing net
revenues declined due to higher promotional spending.
Segment operating income increased $195 million (26.9%), due primarily to the 2005 asset impairment charges related to the
divested Canadian grocery assets and fruit snacks assets, lower marketing, administration and research costs, favorable currency
and higher pricing, net of unfavorable costs. These favorabilities were partially offset by unfavorable volume/mix and the
impact of divestitures.
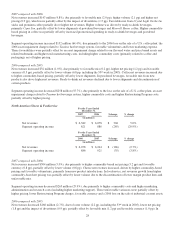
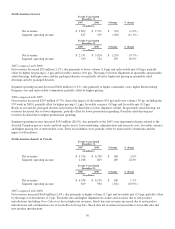
North America Snacks & Cereals For the Years Ended
December 31,
2007 2006 $ change % change
(in millions)
Net revenues $ 6,526 $ 6,358 $ 168 2.6%
Segment operating income 1,018 829 189 22.8%
For the Years Ended
December 31,
2006 2005 $ change % change
(in millions)
Net revenues $ 6,358 $ 6,250 $ 108 1.7%
Segment operating income 829 930 (101) (10.9%)
2007 compared with 2006:
Net revenues increased $168 million (2.6%), due primarily to higher volume (2.3 pp) and favorable mix (2.0 pp), partially offset
by the impact of divestitures (2.2 pp). Favorable mix and higher shipments in cookies and crackers due to new product
introductions (including Oreo Cakesters) drove higher net revenues. Snack bars net revenues increased due to new product
introductions and continued success of South Beach Living bars. Snack nuts net revenues increased due to favorable mix and
new product introductions.
30