Kraft 2007 Annual Report Download - page 14
Download and view the complete annual report
Please find page 14 of the 2007 Kraft annual report below. You can navigate through the pages in the report by either clicking on the pages listed below, or by using the keyword search tool below to find specific information within the annual report.-
 1
1 -
2
-
3
-
 4
4 -
 5
5 -
 6
6 -
 7
7 -
 8
8 -
 9
9 -
 10
10 -
 11
11 -
 12
12 -
 13
13 -
 14
14 -
 15
15 -
 16
16 -
 17
17 -
 18
18 -
 19
19 -
 20
20 -
 21
21 -
 22
22 -
 23
23 -
 24
24 -
25
-
26
-
27
-
28
-
29
-
30
-
31
-
32
-
33
-
34
-
35
-
36
-
37
-
38
-
39
-
40
-
41
-
42
-
43
-
44
-
45
-
46
-
47
-
48
-
49
-
50
-
51
-
52
-
53
-
54
-
55
-
56
-
57
-
58
-
59
-
60
-
61
-
62
-
63
-
64
-
65
-
66
-
67
-
68
-
69
-
70
-
71
-
72
-
73
-
74
-
75
-
76
-
77
-
78
-
79
-
80
-
81
-
82
-
83
-
84
-
85
-
86
-
87
-
88
-
89
-
90
-
91
-
92
-
93
-
94
-
95
-
96
-
97
-
98
-
99
-
100
-
101
-
102
-
103
-
104
-
105
-
106
-
107
-
108
 |
 |
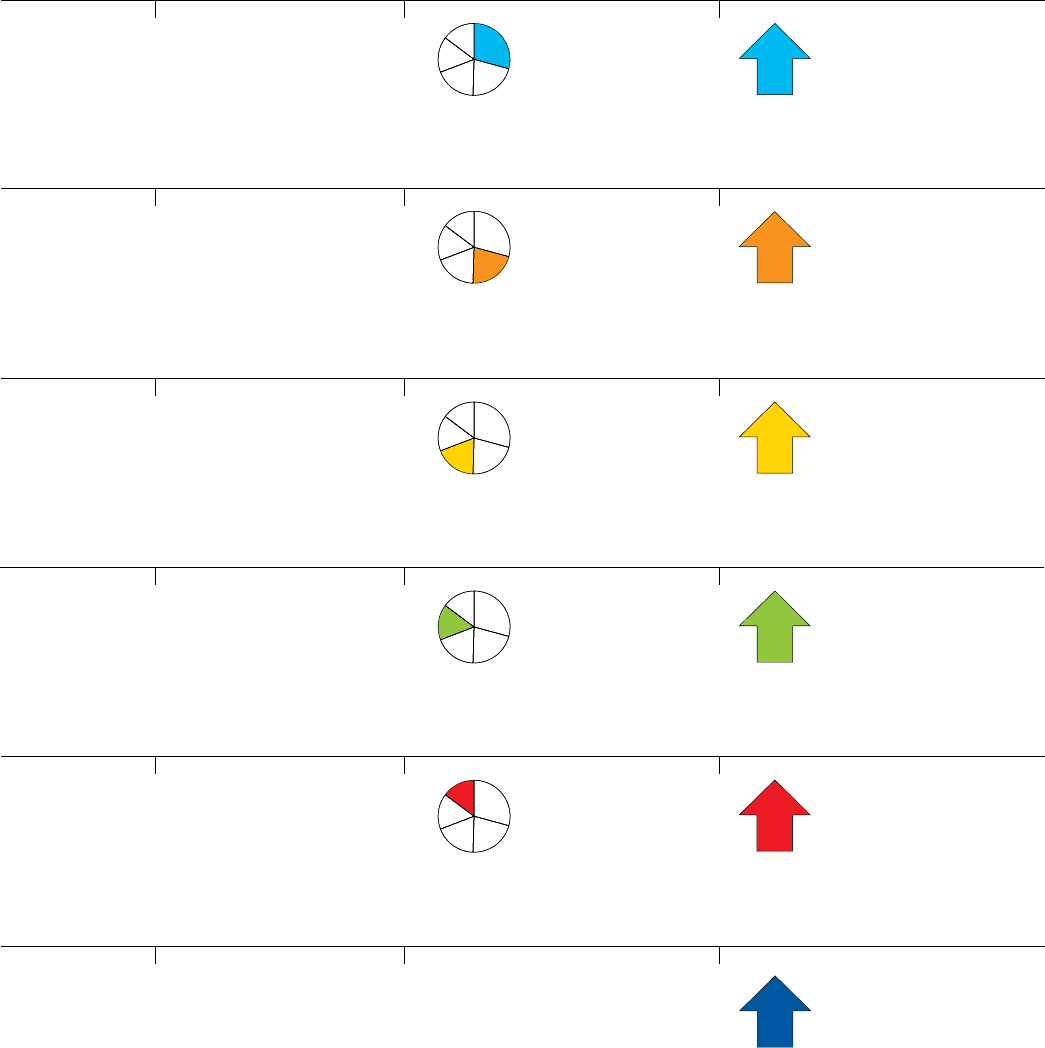
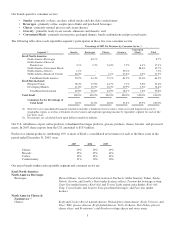
2007 Consumer Sector Data
Net Revenues
in Billions*
Revenue Change
Versus Prior Year
Percentage of
2007 Net Revenues*
$ 37.2 +
8.4%
*Does not add due to rounding
Total
Snacks $ 11.4 + 13.3%
31%
Beverages $ 8.1+ 10.0%
22 %
Cheese $ 6.9 +
8.0%
19%
We are one of the largest food and
beverage companies in the world.
Hundreds of millions of times a day,
we help people eat and live better.
Grocery $ 5.1 + 0.8 %
14%
Convenient
Meals $ 5.8 15%+
4.7%
*
12