Kraft 2007 Annual Report Download - page 72
Download and view the complete annual report
Please find page 72 of the 2007 Kraft annual report below. You can navigate through the pages in the report by either clicking on the pages listed below, or by using the keyword search tool below to find specific information within the annual report.-
 1
1 -
2
-
3
-
4
-
5
-
6
-
7
-
8
-
9
-
10
-
11
-
12
-
13
-
14
-
15
-
16
-
17
-
18
-
19
-
20
-
21
-
22
-
23
-
24
-
25
-
26
-
27
-
28
-
29
-
30
-
31
-
32
-
33
-
34
-
35
-
36
-
37
-
38
-
39
-
40
-
41
-
42
-
43
-
44
-
45
-
46
-
47
-
48
-
49
-
50
-
51
-
52
-
53
-
54
-
55
-
56
-
57
-
58
-
59
-
60
-
61
-
 62
62 -
 63
63 -
 64
64 -
 65
65 -
 66
66 -
 67
67 -
 68
68 -
 69
69 -
 70
70 -
 71
71 -
 72
72 -
 73
73 -
 74
74 -
 75
75 -
 76
76 -
 77
77 -
 78
78 -
 79
79 -
 80
80 -
 81
81 -
 82
82 -
83
-
84
-
85
-
86
-
87
-
88
-
89
-
90
-
91
-
92
-
93
-
94
-
95
-
96
-
97
-
98
-
99
-
100
-
101
-
102
-
103
-
104
-
105
-
106
-
107
-
108
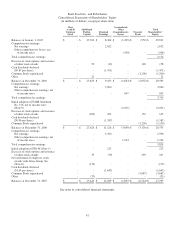
 |
 |

For the Year Ended December 31, 2005
Restructuring
Costs
Asset
Impairment
Total Asset
Impairment
and Exit Costs
Implementation
Costs Total
(in millions)
North America Beverages $ 11 $ - $ 11 $ 10 $ 21
North America Cheese &
Foodservice 15 - 15 4 19
North America Convenient Meals 13 - 13 7 20
North America Grocery 21 206 227 8 235
North America Snacks & Cereals 6 63 69 26 95
European Union 127 - 127 20 147
Developing Markets (1) 17 -171229
Total $ 210 $ 269 $ 479 $ 87 $ 566
(1) This segment was formerly known as Developing Markets, Oceania & North Asia
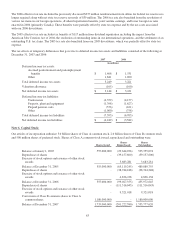
Note 3. Goodwill and Intangible Assets:
At December 31, 2007 and 2006, goodwill by reportable segment was:
2007 2006
(in millions)
North America Beverages $ 1,371 $ 1,372
North America Cheese
& Foodservice 4,212 4,218
North America Convenient Meals 2,172 2,167
North America Grocery 3,055 3,058
North America Snacks & Cereals 8,600 8,696
European Union 9,392 5,004
Developing Markets 2,391 1,038
Total goodwill $ 31,193 $ 25,553
Intangible assets at December 31, 2007 and 2006 were:
2007 2006
Intangible
Assets, at cost
Accumulated
Amortization
Intangible
Assets, at cost
Accumulated
Amortization
(in millions)
Non-amortizable intangible assets $ 12,065 $ 10,150
Amortizable intangible assets 197 $ 62 94 $ 67
Total other intangible assets $ 12,262 $ 62 $ 10,244 $ 67
Non-amortizable intangible assets consist substantially of brand names purchased through our acquisitions of Nabisco Holdings
Corp. (“Nabisco”), the global biscuit business of Groupe Danone S.A. (“Danone Biscuit”), and certain United Biscuits
operations (see Note 11, Acquisitions, for further details). Amortizable intangible assets consist primarily of trademark licenses
and non-compete agreements. In 2007, we completed the purchase price allocation and reclassified $101 million from
non-amortizable to amortizable intangible assets as part of the 2006 acquisition of certain United Biscuits operations.
57