Kraft 2007 Annual Report Download - page 18
Download and view the complete annual report
Please find page 18 of the 2007 Kraft annual report below. You can navigate through the pages in the report by either clicking on the pages listed below, or by using the keyword search tool below to find specific information within the annual report.-
 1
1 -
2
-
3
-
4
-
5
-
6
-
7
-
 8
8 -
 9
9 -
 10
10 -
 11
11 -
 12
12 -
 13
13 -
 14
14 -
 15
15 -
 16
16 -
 17
17 -
 18
18 -
 19
19 -
 20
20 -
 21
21 -
 22
22 -
 23
23 -
 24
24 -
 25
25 -
 26
26 -
 27
27 -
 28
28 -
29
-
30
-
31
-
32
-
33
-
34
-
35
-
36
-
37
-
38
-
39
-
40
-
41
-
42
-
43
-
44
-
45
-
46
-
47
-
48
-
49
-
50
-
51
-
52
-
53
-
54
-
55
-
56
-
57
-
58
-
59
-
60
-
61
-
62
-
63
-
64
-
65
-
66
-
67
-
68
-
69
-
70
-
71
-
72
-
73
-
74
-
75
-
76
-
77
-
78
-
79
-
80
-
81
-
82
-
83
-
84
-
85
-
86
-
87
-
88
-
89
-
90
-
91
-
92
-
93
-
94
-
95
-
96
-
97
-
98
-
99
-
100
-
101
-
102
-
103
-
104
-
105
-
106
-
107
-
108
 |
 |

Our brands span five consumer sectors:
•Snacks - primarily cookies, crackers, salted snacks and chocolate confectionery;
•Beverages - primarily coffee, aseptic juice drinks and powdered beverages;
•Cheese - primarily natural, process and cream cheeses;
•Grocery - primarily ready-to-eat cereals, enhancers and desserts; and
•Convenient Meals - primarily frozen pizza, packaged dinners, lunch combinations and processed meats.
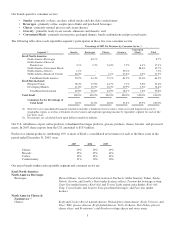
The following table shows each reportable segment’s participation in these five core consumer sectors.
Percentage of 2007 Net Revenues by Consumer Sector (2)
Segment (1) Snacks Beverages Cheese Grocery
Convenient
Meals Total
Kraft North America:
North America Beverages - 40.1% - - - 8.7%
North America Cheese &
Foodservice 3.1% 3.3% 74.0% 7.9% 4.1% 17.1%
North America Convenient Meals ----88.4% 13.7%
North America Grocery 1.1% - - 50.2% - 7.2%
North America Snacks & Cereals 46.0% - 1.1% 23.8% 0.1% 17.5%
Total Kraft North America 50.2% 43.4% 75.1% 81.9% 92.6% 64.2%
Kraft International:
European Union 28.2% 37.6% 14.7% 7.2% 5.8% 21.4%
Developing Markets 21.6% 19.0% 10.2% 10.9% 1.6% 14.4%
Total Kraft International 49.8% 56.6% 24.9% 18.1% 7.4% 35.8%
Total Kraft 100.0% 100.0% 100.0% 100.0% 100.0% 100.0%
Consumer Sector Percentage of
Total Kraft 30.5% 21.6% 18.6% 13.8% 15.5% 100.0%
(1) Note 16 to our consolidated financial statements includes a breakout of net revenues, total assets and long-lived assets by
geographic region, as well as a breakout of net revenues and segment operating income by reportable segment for each of the
last three years.
(2) Percentages are calculated based upon dollars rounded to millions.
Our U.S. subsidiaries export coffee products, refreshment beverages products, grocery products, cheese, biscuits, and processed
meats. In 2007, these exports from the U.S. amounted to $153 million.
Products or similar products contributing 10% or more of Kraft’s consolidated net revenues for each of the three years in the
period ended December 31, 2007, were:
2007 2006 2005
Cheese 19% 19% 19%
Biscuits 15% 15% 14%
Coffee 14% 14% 14%
Confectionery 11% 10% 10%
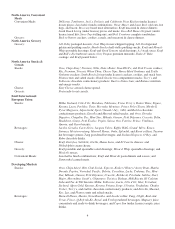
Our major brands within each reportable segment and consumer sector are:
Kraft North America:
North America Beverages
Beverages: Maxwell House, General Foods International, Starbucks (under license), Yuban, Sanka,
Nabob, Gevalia, and Seattle’s Best (under license) coffees; Tassimo hot beverage system;
Capri Sun (under license), Kool-Aid, and Crystal Light aseptic juice drinks; Kool-Aid,
Tang, Crystal Light, and Country Time powdered beverages; and Tazo teas (under
license).
North America Cheese &
Foodservice (1)
Cheese: Kraft and Cracker Barrel natural cheeses; Philadelphia cream cheese; Kraft,Velveeta, and
Cheez Whiz process cheeses; Kraft grated cheeses; Polly-O cheese; Deli Deluxe process
cheese slices; and Breakstone’s and Knudsen cottage cheese and sour cream.
3