Kraft 2007 Annual Report Download - page 46
Download and view the complete annual report
Please find page 46 of the 2007 Kraft annual report below. You can navigate through the pages in the report by either clicking on the pages listed below, or by using the keyword search tool below to find specific information within the annual report.-
 1
1 -
2
-
3
-
4
-
5
-
6
-
7
-
8
-
9
-
10
-
11
-
12
-
13
-
14
-
15
-
16
-
17
-
18
-
19
-
20
-
21
-
22
-
23
-
24
-
25
-
26
-
27
-
28
-
29
-
30
-
31
-
32
-
33
-
34
-
35
-
 36
36 -
 37
37 -
 38
38 -
 39
39 -
 40
40 -
 41
41 -
 42
42 -
 43
43 -
 44
44 -
 45
45 -
 46
46 -
 47
47 -
 48
48 -
 49
49 -
 50
50 -
 51
51 -
 52
52 -
 53
53 -
 54
54 -
 55
55 -
 56
56 -
57
-
58
-
59
-
60
-
61
-
62
-
63
-
64
-
65
-
66
-
67
-
68
-
69
-
70
-
71
-
72
-
73
-
74
-
75
-
76
-
77
-
78
-
79
-
80
-
81
-
82
-
83
-
84
-
85
-
86
-
87
-
88
-
89
-
90
-
91
-
92
-
93
-
94
-
95
-
96
-
97
-
98
-
99
-
100
-
101
-
102
-
103
-
104
-
105
-
106
-
107
-
108
 |
 |

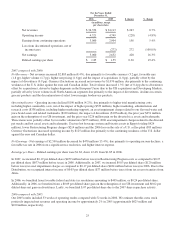
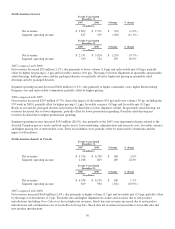
Segment operating income increased $189 million (22.8%), due primarily to 2006 asset impairment charges related to the
divested pet snacks and hot cereal assets and trademarks, favorable volume/mix and lower Restructuring Program charges.
These favorable variances were partially offset by higher marketing, administration and research costs (including higher
marketing support) and the impact of divestitures.
2006 compared with 2005:
Net revenues increased $108 million (1.7%), due to favorable volume/mix (1.8 pp, including the 53rd week in 2005), higher net
pricing (1.4 pp) and favorable currency (0.6 pp), partially offset by the impact of divestitures (2.1 pp). Biscuit net revenues
increased due to higher pricing to offset the impact of commodity cost increases in energy and packaging, higher shipment
volume and favorable mix. In snack bars, net revenue increases were driven by new product introductions. Canadian snack net
revenues also increased due to sales of co-manufactured products related to the 2005 divested confectionery business. Snack
nuts net revenues decreased due to lower shipments.
Segment operating income decreased $101 million (10.9%), due primarily to asset impairment charges related to the divested
pet snacks and hot cereal assets and trademarks, higher product costs, the impact of divestitures and higher Restructuring
Program costs. These unfavorable items were partially offset by higher net pricing, the 2005 asset impairment charge in
anticipation of the 2006 sale of a small U.S. biscuit brand, lower marketing spending and lower fixed manufacturing costs.
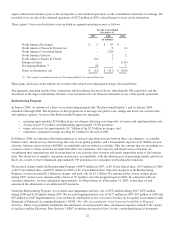
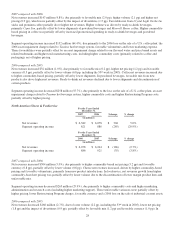
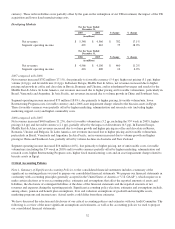
European Union For the Years Ended
December 31,
$ change % change2007 2006
(in millions)
Net revenues $ 7,954 $ 6,672 $ 1,282 19.2%
Segment operating income 571 548 23 4.2%
For the Years Ended
December 31,
$ change % change2006 2005
(in millions)
Net revenues $ 6,672 $ 6,714 $ (42) (0.6%)
Segment operating income 548 722 (174) (24.1%)
2007 compared with 2006:
Net revenues increased $1,282 million (19.2%), due to favorable currency (10.5 pp), the impact of the UB acquisition (5.1 pp),
higher volume (3.4 pp) and favorable mix (1.9 pp), partially offset by lower net pricing (1.7 pp). Volume related growth and
favorable mix were driven by premium chocolate, due to new product introductions and promotional activities, and higher
shipments in mainstream coffee and cheese. Lower net pricing reflects higher promotional spending in chocolate, cheese and
coffee (primarily in Germany).
Segment operating income increased $23 million (4.2%), due primarily to the 2006 asset impairment charge related to Tassimo
hot beverage system, favorable volume/mix, lower Restructuring Program charges, favorable currency, lower fixed
manufacturing costs and the impact of the UB acquisition. Partially offsetting these favorable variances were the prior year gain
on the redemption of our UB investment, higher commodity costs, lower net pricing and higher marketing expense.
2006 compared with 2005:
Net revenues decreased $42 million (0.6%), due to lower volume (1.7 pp, including the 53rd week in 2005), unfavorable
currency (1.3 pp) and the impact of divestitures (0.2 pp), partially offset by the acquisition of UB (1.6 pp), favorable mix (0.9
pp) and higher net pricing (0.1 pp). Volume related declines, net of favorable mix, were driven by lower shipments in cheese,
coffee and refreshment beverages. Net pricing was essentially flat as increased pricing in coffee and chocolate was offset by
higher promotional spending across all categories.
Segment operating income decreased $174 million (24.1%), due primarily to the asset impairment charge related to Tassimo hot
beverage system, the 2005 gain on divested U.K. desserts assets, higher Restructuring Program costs, unfavorable costs and
increased promotional spending, net of higher pricing, higher marketing, administration and research costs and unfavorable
31