Kraft 2007 Annual Report Download - page 43
Download and view the complete annual report
Please find page 43 of the 2007 Kraft annual report below. You can navigate through the pages in the report by either clicking on the pages listed below, or by using the keyword search tool below to find specific information within the annual report.-
 1
1 -
2
-
3
-
4
-
5
-
6
-
7
-
8
-
9
-
10
-
11
-
12
-
13
-
14
-
15
-
16
-
17
-
18
-
19
-
20
-
21
-
22
-
23
-
24
-
25
-
26
-
27
-
28
-
29
-
30
-
31
-
32
-
 33
33 -
 34
34 -
 35
35 -
 36
36 -
 37
37 -
 38
38 -
 39
39 -
 40
40 -
 41
41 -
 42
42 -
 43
43 -
 44
44 -
 45
45 -
 46
46 -
 47
47 -
 48
48 -
 49
49 -
 50
50 -
 51
51 -
 52
52 -
 53
53 -
54
-
55
-
56
-
57
-
58
-
59
-
60
-
61
-
62
-
63
-
64
-
65
-
66
-
67
-
68
-
69
-
70
-
71
-
72
-
73
-
74
-
75
-
76
-
77
-
78
-
79
-
80
-
81
-
82
-
83
-
84
-
85
-
86
-
87
-
88
-
89
-
90
-
91
-
92
-
93
-
94
-
95
-
96
-
97
-
98
-
99
-
100
-
101
-
102
-
103
-
104
-
105
-
106
-
107
-
108
 |
 |

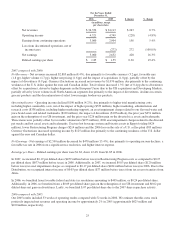
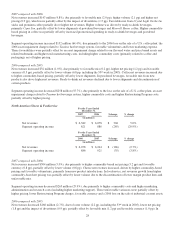
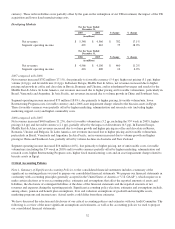
2007 compared with 2006:
Net revenues increased $147 million (4.8%), due primarily to favorable mix (2.9 pp), higher volume (2.1 pp) and higher net
pricing (0.9 pp), which were partially offset by the impact of divestitures (1.5 pp). Favorable mix from Crystal Light On the Go
sticks and premium coffee partially drove higher net revenues. Higher volume was driven by ready-to-drink beverages,
primarily Capri Sun, partially offset by lower shipments of powdered beverages and Maxwell House coffee. Higher commodity-
based pricing in coffee was partially offset by increased promotional spending in ready-to-drink beverages and powdered
beverages.
Segment operating income increased $132 million (64.4%), due primarily to the 2006 loss on the sale of a U.S. coffee plant, the
2006 asset impairment charge related to Tassimo hot beverage system, favorable volume/mix and lower marketing expense.
These favorabilities were partially offset by an asset impairment charge related to our flavored water and juice brand assets and
related trademarks and higher total manufacturing costs, including higher commodity costs (primarily related to coffee and
packaging), net of higher pricing.
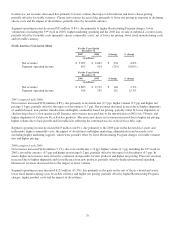
2006 compared with 2005:
Net revenues increased $32 million (1.0%), due primarily to favorable mix (6.2 pp), higher net pricing (1.2 pp) and favorable
currency (0.5 pp), partially offset by lower volume (6.8 pp, including the 53rd week in 2005). Coffee net revenues increased due
to higher commodity-based pricing, partially offset by lower shipments. In powdered beverages, favorable mix from new
products also drove higher net revenues. Ready-to-drink net revenues declined due to lower shipments and discontinuation of
certain products.
Segment operating income decreased $258 million (55.7%), due primarily to the loss on the sale of a U.S. coffee plant, an asset
impairment charge related to Tassimo hot beverage system, higher commodity costs and higher Restructuring Program costs,
partially offset by higher pricing.
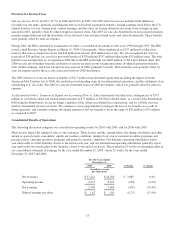
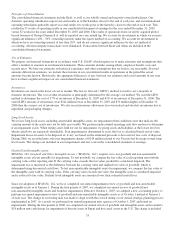
North America Cheese & Foodservice For the Years Ended
December 31,
$ change % change2007 2006
(in millions)
Net revenues $ 6,382 $ 6,078 $ 304 5.0%
Segment operating income 621 886 (265) (29.9%)
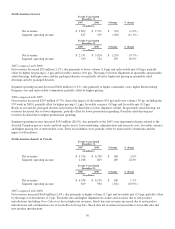
For the Years Ended
December 31,
$ change % change2006 2005
(in millions)
Net revenues $ 6,078 $ 6,244 $ (166) (2.7%)
Segment operating income 886 921 (35) (3.8%)
2007 compared with 2006:
Net revenues increased $304 million (5.0%), due primarily to higher commodity-based net pricing (5.2 pp) and favorable
currency (0.8 pp), partially offset by lower volume (0.8 pp). Cheese net revenues increased, driven by higher commodity-based
pricing and favorable volume/mix, primarily from new product introductions. In foodservice, net revenues growth from higher
commodity-based net pricing was partially offset by lower volume due to the discontinuation of lower margin product lines and
unfavorable mix.
Segment operating income decreased $265 million (29.9%), due primarily to higher commodity costs and higher marketing,
administration and research costs (including higher marketing support). These unfavorable variances were partially offset by
higher pricing, lower Restructuring Program charges, favorable currency and a 2006 loss on the sale of industrial coconut assets.
2006 compared with 2005:
Net revenues decreased $166 million (2.7%), due to lower volume (2.2 pp, including the 53rd week in 2005), lower net pricing
(1.8 pp) and the impact of divestitures (0.9 pp), partially offset by favorable mix (1.2 pp) and favorable currency (1.0 pp). In
28