Kraft 2007 Annual Report Download - page 44
Download and view the complete annual report
Please find page 44 of the 2007 Kraft annual report below. You can navigate through the pages in the report by either clicking on the pages listed below, or by using the keyword search tool below to find specific information within the annual report.-
 1
1 -
2
-
3
-
4
-
5
-
6
-
7
-
8
-
9
-
10
-
11
-
12
-
13
-
14
-
15
-
16
-
17
-
18
-
19
-
20
-
21
-
22
-
23
-
24
-
25
-
26
-
27
-
28
-
29
-
30
-
31
-
32
-
33
-
 34
34 -
 35
35 -
 36
36 -
 37
37 -
 38
38 -
 39
39 -
 40
40 -
 41
41 -
 42
42 -
 43
43 -
 44
44 -
 45
45 -
 46
46 -
 47
47 -
 48
48 -
 49
49 -
 50
50 -
 51
51 -
 52
52 -
 53
53 -
 54
54 -
55
-
56
-
57
-
58
-
59
-
60
-
61
-
62
-
63
-
64
-
65
-
66
-
67
-
68
-
69
-
70
-
71
-
72
-
73
-
74
-
75
-
76
-
77
-
78
-
79
-
80
-
81
-
82
-
83
-
84
-
85
-
86
-
87
-
88
-
89
-
90
-
91
-
92
-
93
-
94
-
95
-
96
-
97
-
98
-
99
-
100
-
101
-
102
-
103
-
104
-
105
-
106
-
107
-
108
 |
 |

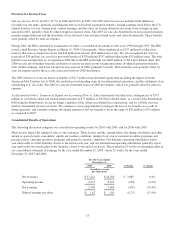
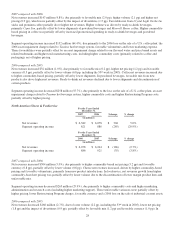
foodservice, net revenues decreased due primarily to lower volume, the impact of divestitures and lower cheese pricing,
partially offset by favorable currency. Cheese net revenues decreased due primarily to lower net pricing in response to declining
cheese costs and the impact of divestitures, partially offset by favorable currency.
Segment operating income decreased $35 million (3.8%), due primarily to higher Restructuring Program charges, lower
volume/mix (including the 53rd week in 2005), higher marketing spending and the 2006 loss on sale of industrial coconut assets,
partially offset by favorable costs (primarily cheese commodity costs), net of lower net pricing, lower fixed manufacturing costs
and favorable currency.
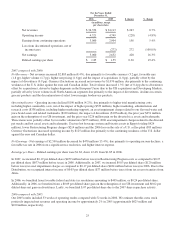
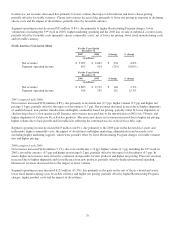
North America Convenient Meals For the Years Ended
December 31,
$ change % change2007 2006
(in millions)
Net revenues $ 5,097 $ 4,863 $ 234 4.8%
Segment operating income 695 914 (219) (24.0%)
For the Years Ended
December 31,
$ change % change2006 2005
(in millions)
Net revenues $ 4,863 $ 4,719 $ 144 3.1%
Segment operating income 914 793 121 15.3%
2007 compared with 2006:
Net revenues increased $234 million (4.8%), due primarily to favorable mix (2.7 pp), higher volume (2.5 pp) and higher net
pricing (1.0 pp), partially offset by the impact of divestitures (1.7 pp). Net revenues increased in meat due to higher shipments
of sandwich meat, new product introductions and higher commodity-based net pricing, partially offset by lower shipments of
chicken strips due to a first quarter recall. In pizza, net revenues increased due to the introduction of DiGiorno Ultimate and
higher shipments of California Pizza Kitchen products. Macaroni and cheese net revenues increased due to higher net pricing,
higher volume due to base growth and favorable mix reflecting the continued success of Kraft Easy-Mac cups.
Segment operating income decreased $219 million (24.0%), due primarily to the 2006 gain on the divested rice assets and
trademarks, higher commodity costs, the impact of divestitures and higher marketing, administration and research costs
(including higher marketing support), which were partially offset by lower Restructuring Program charges, favorable volume/
mix and higher pricing.
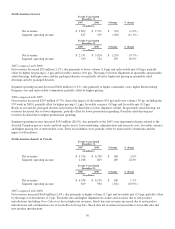
2006 compared with 2005:
Net revenues increased $144 million (3.1%), due to favorable mix (1.8 pp), higher volume (1.1 pp, including the 53rd week in
2005), favorable currency (0.3 pp) and higher net pricing (0.2 pp), partially offset by the impact of divestitures (0.3 pp). In
meats, higher net revenues were driven by continued strong results for new products and higher net pricing. Pizza net revenues
increased due to higher shipments and favorable mix from new products, partially offset by higher promotional spending.
Dinners net revenues decreased due to the impact of lower volume.
Segment operating income increased $121 million (15.3%), due primarily to the gain on the sale of the rice brand and assets,
lower fixed manufacturing costs, favorable currency and higher net pricing, partially offset by higher Restructuring Program
charges, higher product costs and the impact of divestitures.
29