Kraft 2007 Annual Report Download - page 53
Download and view the complete annual report
Please find page 53 of the 2007 Kraft annual report below. You can navigate through the pages in the report by either clicking on the pages listed below, or by using the keyword search tool below to find specific information within the annual report.-
 1
1 -
2
-
3
-
4
-
5
-
6
-
7
-
8
-
9
-
10
-
11
-
12
-
13
-
14
-
15
-
16
-
17
-
18
-
19
-
20
-
21
-
22
-
23
-
24
-
25
-
26
-
27
-
28
-
29
-
30
-
31
-
32
-
33
-
34
-
35
-
36
-
37
-
38
-
39
-
40
-
41
-
42
-
 43
43 -
 44
44 -
 45
45 -
 46
46 -
 47
47 -
 48
48 -
 49
49 -
 50
50 -
 51
51 -
 52
52 -
 53
53 -
 54
54 -
 55
55 -
 56
56 -
 57
57 -
 58
58 -
 59
59 -
 60
60 -
 61
61 -
 62
62 -
 63
63 -
64
-
65
-
66
-
67
-
68
-
69
-
70
-
71
-
72
-
73
-
74
-
75
-
76
-
77
-
78
-
79
-
80
-
81
-
82
-
83
-
84
-
85
-
86
-
87
-
88
-
89
-
90
-
91
-
92
-
93
-
94
-
95
-
96
-
97
-
98
-
99
-
100
-
101
-
102
-
103
-
104
-
105
-
106
-
107
-
108
 |
 |

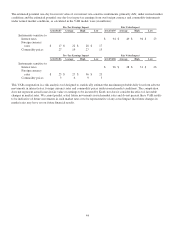
biscuit, cereal, and grocery products are grains or wheat, corn, and soybean oil. Grain costs have experienced significant cost
increases as a result of burgeoning global demand for food, livestock feed and biofuels such as ethanol and biodiesel. In 2007,
grain costs on average were higher than in 2006.
During 2007, our aggregate commodity costs rose significantly as a result of higher dairy, coffee, cocoa, wheat, meat products,
soybean oil and packaging costs, partially offset by lower nut costs. For 2007, our commodity costs were approximately
$1,250 million higher than 2006, following an increase of approximately $275 million in 2006 compared to 2005. We expect the
higher cost environment to continue, particularly for dairy, grains, energy and packaging.
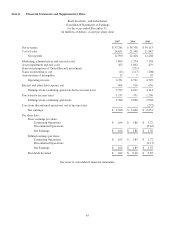
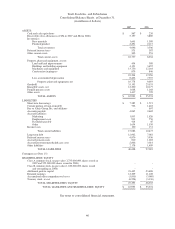
Liquidity
We believe that our cash from operations, our existing $4.5 billion credit facility, and our authorized long-term financing will
provide sufficient liquidity to meet our working capital needs (including the cash requirements of the Restructuring Program),
planned capital expenditures, future contractual obligations, authorized share repurchases, and payment of our anticipated
quarterly dividends.
Net Cash Provided by Operating Activities:
Operating activities provided net cash of $3.6 billion in 2007, $3.7 billion in 2006 and $3.5 billion in 2005. Operating cash
flows decreased in 2007 from 2006 primarily due to the $405 million tax reimbursement from Altria in 2006 related to the
closure of a tax audit and increased marketing administration and research costs. This decrease in operating cash flows was
partially offset by lower working capital costs of $225 million primarily due to lower income tax payments and the $305 million
tax transfer from Altria for the federal tax contingencies held by them, less the impact of federal reserves reversed due to the
adoption of FIN 48. The transfer from Altria is reflected within other in our consolidated statements of cash flows.
The increase in 2006 operating cash flows from 2005 is due primarily to the previously discussed tax reimbursement from Altria
in 2006 related to the closure of a tax audit and higher earnings, partially offset by a decrease in amounts due to Altria and
higher pension contributions.
Net Cash Provided by (Used in) Investing Activities:
One element of our growth strategy is to strengthen our brand portfolios and/or expand our geographic reach through disciplined
programs of selective acquisitions and divestitures. We are constantly reviewing potential acquisition candidates and from time
to time sell businesses to accelerate the shift in our portfolio toward businesses - whether global, regional or local - that offer us
a sustainable competitive advantage. The impact of future acquisitions or divestitures could have a material impact on our cash
flows.
Net cash used in investing activities was $8.4 billion during 2007 and $116 million during 2006, as compared with net cash
provided by investing activities of $525 million in 2005. The increase in cash used in investing activities in 2007 primarily
related to the Danone Biscuit acquisition and lower proceeds from divestitures. On November 30, 2007, we acquired the global
biscuit business of Groupe Danone S.A. for approximately €5.1 billion (approximately $7.6 billion) in cash subject to purchase
price adjustments.
During 2007, we received proceeds of $216 million from the sales of our flavored water and juice brand assets and related
trademarks, our sugar confectionery assets in Romania and related trademarks and our hot cereal assets and trademarks. During
2006, we received proceeds of $946 million from the sales of our rice brand and assets, pet snacks brand and assets, industrial
coconut assets, certain Canadian assets, a small U.S. biscuit brand and a U.S. coffee plant. During 2005, we received proceeds
of $1,668 million from the sales of our sugar confectionery business, fruit snacks assets, U.K. desserts assets, U.S. yogurt assets,
a small operation in Colombia, a small equity investment in Turkey and a minor trademark in Mexico.
Capital expenditures, which were funded by operating activities, were $1.2 billion in each of the last three years. The 2007
capital expenditures were primarily to modernize manufacturing facilities, implement the Restructuring Program, and support
new product and productivity initiatives. We expect 2008 capital expenditures to be in line with 2007 expenditures, including
capital expenditures required for the Restructuring Program and systems investments. We expect to fund these expenditures
from operations.
Net Cash Used in Financing Activities:
During 2007, we received $5.1 billion net cash in financing activities, compared with $3.7 billion that we used during 2006. The
increase in net cash provided by financing activities is due primarily to the $3.5 billion and $3.0 billion long-term debt offerings
38