Kraft 2007 Annual Report Download - page 32
Download and view the complete annual report
Please find page 32 of the 2007 Kraft annual report below. You can navigate through the pages in the report by either clicking on the pages listed below, or by using the keyword search tool below to find specific information within the annual report.-
 1
1 -
2
-
3
-
4
-
5
-
6
-
7
-
8
-
9
-
10
-
11
-
12
-
13
-
14
-
15
-
16
-
17
-
18
-
19
-
20
-
21
-
 22
22 -
 23
23 -
 24
24 -
 25
25 -
 26
26 -
 27
27 -
 28
28 -
 29
29 -
 30
30 -
 31
31 -
 32
32 -
 33
33 -
 34
34 -
 35
35 -
 36
36 -
 37
37 -
 38
38 -
 39
39 -
 40
40 -
 41
41 -
 42
42 -
43
-
44
-
45
-
46
-
47
-
48
-
49
-
50
-
51
-
52
-
53
-
54
-
55
-
56
-
57
-
58
-
59
-
60
-
61
-
62
-
63
-
64
-
65
-
66
-
67
-
68
-
69
-
70
-
71
-
72
-
73
-
74
-
75
-
76
-
77
-
78
-
79
-
80
-
81
-
82
-
83
-
84
-
85
-
86
-
87
-
88
-
89
-
90
-
91
-
92
-
93
-
94
-
95
-
96
-
97
-
98
-
99
-
100
-
101
-
102
-
103
-
104
-
105
-
106
-
107
-
108
 |
 |

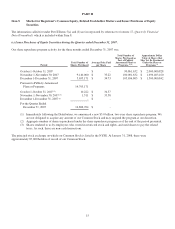
Item 6. Selected Financial Data.
Kraft Foods Inc.
Selected Financial Data - Five Year Review (in millions of dollars, except per share and employee data)
2007 2006 2005 2004 2003
Summary of Operations:
Net revenues $ 37,241 $ 34,356 $ 34,113 $ 32,168 $ 30,498
Cost of sales 24,651 21,940 21,845 20,281 18,531
Operating income 4,331 4,521 4,749 4,609 5,856
Interest and other debt expense, net 604 510 636 666 665
Earnings from continuing operations, before
income taxes 3,727 4,011 4,113 3,943 5,191
Pre-tax profit margin from continuing operations 10.0% 11.7% 12.1% 12.3% 17.0%
Provision for income taxes 1,137 951 1,209 1,274 1,812
(Loss) / earnings from discontinued operations, net
of income taxes - - (272) (4) 97
Net earnings 2,590 3,060 2,632 2,665 3,476
Basic EPS:
Continuing operations 1.64 1.86 1.72 1.56 1.95
Discontinued operations - - (0.16) - 0.06
Net earnings 1.64 1.86 1.56 1.56 2.01
Diluted EPS:
Continuing operations 1.62 1.85 1.72 1.55 1.95
Discontinued operations - - (0.17) - 0.06
Net earnings 1.62 1.85 1.55 1.55 2.01
Dividends declared per share 1.04 0.96 0.87 0.77 0.66
Weighted average shares (millions) - Basic 1,575 1,643 1,684 1,709 1,727
Weighted average shares (millions) - Diluted 1,594 1,655 1,693 1,714 1,728
Capital expenditures 1,241 1,169 1,171 1,006 1,085
Depreciation 873 884 869 868 804
Property, plant and equipment, net 10,778 9,693 9,817 9,985 10,155
Inventories 4,096 3,506 3,343 3,447 3,343
Total assets 67,993 55,574 57,628 59,928 59,285
Long-term debt 12,902 7,081 8,475 9,723 11,591
Total debt 21,009 10,821 11,200 12,518 13,462
Shareholders’ equity 27,295 28,555 29,593 29,911 28,530
Common dividends declared as a % of Basic EPS 63.4% 51.6% 55.8% 49.4% 32.8%
Common dividends declared as a % of Diluted EPS 64.2% 51.9% 56.1% 49.7% 32.8%
Book value per common share outstanding 17.79 17.45 17.72 17.54 16.57
Market price per Common Stock share - high/low 37.20-29.95 36.67-27.44 35.65-27.88 36.06-29.45 39.40-26.35
Closing price of Common Stock at year end 32.63 35.70 28.17 35.61 32.22
Price / earnings ratio at year end - Basic 20 19 18 23 16
Price / earnings ratio at year end - Diluted 20 19 18 23 16
Number of common shares outstanding at year
end (millions) 1,534 1,636 1,670 1,705 1,722
Number of employees 103,000 90,000 94,000 98,000 106,000
17