Kraft 2007 Annual Report Download - page 41
Download and view the complete annual report
Please find page 41 of the 2007 Kraft annual report below. You can navigate through the pages in the report by either clicking on the pages listed below, or by using the keyword search tool below to find specific information within the annual report.-
 1
1 -
2
-
3
-
4
-
5
-
6
-
7
-
8
-
9
-
10
-
11
-
12
-
13
-
14
-
15
-
16
-
17
-
18
-
19
-
20
-
21
-
22
-
23
-
24
-
25
-
26
-
27
-
28
-
29
-
30
-
 31
31 -
 32
32 -
 33
33 -
 34
34 -
 35
35 -
 36
36 -
 37
37 -
 38
38 -
 39
39 -
 40
40 -
 41
41 -
 42
42 -
 43
43 -
 44
44 -
 45
45 -
 46
46 -
 47
47 -
 48
48 -
 49
49 -
 50
50 -
 51
51 -
52
-
53
-
54
-
55
-
56
-
57
-
58
-
59
-
60
-
61
-
62
-
63
-
64
-
65
-
66
-
67
-
68
-
69
-
70
-
71
-
72
-
73
-
74
-
75
-
76
-
77
-
78
-
79
-
80
-
81
-
82
-
83
-
84
-
85
-
86
-
87
-
88
-
89
-
90
-
91
-
92
-
93
-
94
-
95
-
96
-
97
-
98
-
99
-
100
-
101
-
102
-
103
-
104
-
105
-
106
-
107
-
108
 |
 |
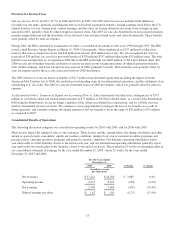
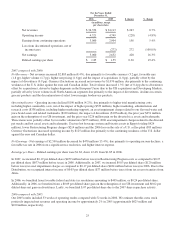
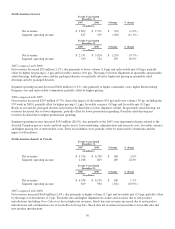
Net Revenues - Net revenues increased $243 million (0.7%), due primarily to favorable volume/mix (0.7pp, including the 53rd
week in 2005), higher net pricing (0.7pp), favorable currency (0.5 pp) and the impact of acquisitions (0.3pp), partially offset by
the impact of divestitures (1.5pp). Currency fluctuations increased net revenues by $145 million due primarily to the weakness
of the U.S. dollar against the Canadian dollar and the Brazilian real, partially offset by the strength of the U.S. dollar against the
euro. Volume decreased 961 million pounds (5.0%), including the 53rd week in 2005 results. Excluding the impact of
divestitures, the acquisition of UB and the 53rd week of shipments in 2005, volume decreased 0.4%, due primarily to the
discontinuation of certain ready-to-drink and foodservice product lines and lower grocery shipments in North America, partially
offset by higher shipments of meat, biscuits and cheese in North America and higher shipments in Developing Markets.
Operating Income - Operating income declined $228 million (4.8%), due primarily to higher Restructuring Program costs
($376 million), higher asset impairment charges ($155 million), 2005 net gains on divestitures ($108 million), higher marketing,
administrative and research costs ($78 million), and the impact of divestitures ($71 million). These impacts were partially offset
by the 2006 gain on redemption of our UB investment ($251 million), the 2006 net gains on divestitures ($117 million), higher
pricing, net of increased promotional spending and higher input costs ($72 million), lower fixed manufacturing costs
($40 million), favorable volume/mix ($32 million, including the 53rd week in 2005) and the acquisition of UB ($18 million).
Currency fluctuations increased operating income by $29 million due primarily to the weakness of the U.S. dollar against the
Canadian dollar and the Brazilian real, partially offset by the strength of the U.S. dollar against the euro.
Earnings from Continuing Operations - Earnings from continuing operations of $3,060 million increased $156 million (5.4%),
due primarily to a favorable tax rate resulting from a significant tax resolution in 2006 and lower interest expense, partially
offset by lower operating income.
Loss from discontinued operations - In June 2005, we sold substantially all of our sugar confectionery business for proceeds of
approximately $1.4 billion. We reflected the results of our sugar confectionery business prior to the closing date as discontinued
operations on the consolidated statements of earnings. We recorded a loss on sale of discontinued operations of $272 million in
2005, related largely to taxes on the transaction.
Net Earnings - Net earnings of $3,060 million increased $428 million (16.3%) due to increased earnings from continuing
operations and the 2005 loss from discontinued operations.
Earnings per Share - Diluted earnings per share were $1.85, up 19.4% from $1.55 in 2005.
In 2006, we incurred $0.27 per diluted share ($673 million before taxes) in Restructuring Program costs as compared to $0.12
per diluted share ($297 million before taxes) in 2005. Additionally, in 2006, we incurred $0.17 per diluted share ($424 million
before taxes) in asset impairment charges as compared to $0.08 per diluted share ($269 million before taxes) in 2005. In 2006,
we also benefited from favorable federal and state tax resolutions amounting to $405 million, or $0.24 per diluted share.
Additionally, in 2006, we benefited from a $0.09 per diluted share gain on the redemption of our UB investment and $0.02 per
diluted share net gain on divestitures as compared to a $0.04 per diluted share net gain on divestitures in 2005. Lastly, we
benefited $.04 per diluted share due to the 2006 share repurchase activity.
Results of Operations by Business Segment
We manage and report operating results through two commercial units, Kraft North America and Kraft International. We
manage Kraft North America’s operations by product category, and Kraft International’s operations by geographic location.
Kraft North America’s segments are North America Beverages; North America Cheese & Foodservice; North America
Convenient Meals; North America Grocery; and North America Snacks & Cereals. The two international segments are
European Union; and Developing Markets (formerly known as Developing Markets, Oceania & North Asia), the latter to reflect
our increased management focus on developing markets.
26