Kraft 2007 Annual Report Download - page 47
Download and view the complete annual report
Please find page 47 of the 2007 Kraft annual report below. You can navigate through the pages in the report by either clicking on the pages listed below, or by using the keyword search tool below to find specific information within the annual report.-
 1
1 -
2
-
3
-
4
-
5
-
6
-
7
-
8
-
9
-
10
-
11
-
12
-
13
-
14
-
15
-
16
-
17
-
18
-
19
-
20
-
21
-
22
-
23
-
24
-
25
-
26
-
27
-
28
-
29
-
30
-
31
-
32
-
33
-
34
-
35
-
36
-
 37
37 -
 38
38 -
 39
39 -
 40
40 -
 41
41 -
 42
42 -
 43
43 -
 44
44 -
 45
45 -
 46
46 -
 47
47 -
 48
48 -
 49
49 -
 50
50 -
 51
51 -
 52
52 -
 53
53 -
 54
54 -
 55
55 -
 56
56 -
 57
57 -
58
-
59
-
60
-
61
-
62
-
63
-
64
-
65
-
66
-
67
-
68
-
69
-
70
-
71
-
72
-
73
-
74
-
75
-
76
-
77
-
78
-
79
-
80
-
81
-
82
-
83
-
84
-
85
-
86
-
87
-
88
-
89
-
90
-
91
-
92
-
93
-
94
-
95
-
96
-
97
-
98
-
99
-
100
-
101
-
102
-
103
-
104
-
105
-
106
-
107
-
108
 |
 |

currency. These unfavorabilities were partially offset by the gain on the redemption of our UB investment, the impact of the UB
acquisition and lower fixed manufacturing costs.
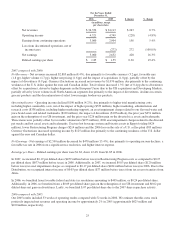
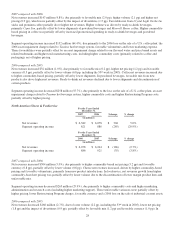
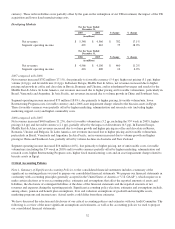
Developing Markets For the Years Ended
December 31,
$ change % change2007 2006
(in millions)
Net revenues $ 5,348 $ 4,566 $ 782 17.1%
Segment operating income 491 416 75 18.0%
For the Years Ended
December 31,
$ change % change2006 2005
(in millions)
Net revenues $ 4,566 $ 4,106 $ 460 11.2%
Segment operating income 416 400 16 4.0%
2007 compared with 2006:
Net revenues increased $782 million (17.1%), due primarily to favorable currency (5.4 pp), higher net pricing (5.1 pp), higher
volume (4.0 pp), and favorable mix (2.4 pp). In Eastern Europe, Middle East & Africa, net revenues increased due to higher
pricing and growth in coffee and chocolate in Russia, Romania and Ukraine, and in refreshment beverages and snacks for the
Middle East & Africa. In Latin America, net revenues increased due to higher pricing and favorable volume/mix, particularly in
Brazil, Venezuela and Argentina. In Asia Pacific, net revenues increased due to volume growth in China and Southeast Asia.
Segment operating income increased $75 million (18.0%), due primarily to higher pricing, favorable volume/mix, lower
Restructuring Program costs, favorable currency and a 2006 asset impairment charge related to the biscuits assets in Egypt.
These favorable variances were partially offset by higher marketing, administration and research costs (including higher
marketing support costs) and higher commodity costs.
2006 compared with 2005:
Net revenues increased $460 million (11.2%), due to favorable volume/mix (5.2 pp, including the 53rd week in 2005), higher
pricing (4.4 pp) and favorable currency (2.1 pp), partially offset by the impact of divestitures (0.5 pp). In Eastern Europe,
Middle East & Africa, net revenues increased due to volume growth and higher pricing in coffee and chocolate in Russia,
Romania, Ukraine and Bulgaria. In Latin America, net revenues increased due to higher pricing and favorable volume/mix,
particularly in Brazil, Venezuela and Argentina. In Asia Pacific, net revenues increased due to volume growth and higher
pricing in China and Southeast Asia, partially offset by volume declines in Australia and New Zealand.
Segment operating income increased $16 million (4.0%), due primarily to higher pricing, net of unfavorable costs, favorable
volume/mix (including the 53rd week in 2005) and favorable currency partially offset by higher marketing, administration and
research costs, higher Restructuring Program costs, higher fixed manufacturing costs and an asset impairment charge related to
biscuits assets in Egypt.
Critical Accounting Policies
Note 1, Summary of Significant Accounting Policies, to the consolidated financial statements includes a summary of the
significant accounting policies we used to prepare our consolidated financial statements. We prepare our financial statements in
conformity with accounting principles generally accepted in the United States of America (“U.S. GAAP”), which require us to
make certain elections as to our accounting policy, estimates and assumptions that affect the reported amounts of assets and
liabilities, the disclosure of contingent liabilities at the dates of the financial statements and the reported amounts of net
revenues and expenses during the reporting periods. Significant accounting policy elections, estimates and assumptions include,
among others, pension and benefit plan assumptions, lives and valuation assumptions of goodwill and intangible assets,
marketing programs and income taxes. Actual results could differ from those estimates.
We have discussed the selection and disclosure of our critical accounting policies and estimates with our Audit Committee. The
following is a review of the more significant assumptions and estimates, as well as the accounting policies we used to prepare
our consolidated financial statements.
32