Honeywell 2005 Annual Report Download - page 98
Download and view the complete annual report
Please find page 98 of the 2005 Honeywell annual report below. You can navigate through the pages in the report by either clicking on the pages listed below, or by using the keyword search tool below to find specific information within the annual report.-
 1
1 -
2
-
3
-
4
-
5
-
6
-
7
-
8
-
9
-
10
-
11
-
12
-
13
-
14
-
15
-
16
-
17
-
18
-
19
-
20
-
21
-
22
-
23
-
24
-
25
-
26
-
27
-
28
-
29
-
30
-
31
-
32
-
33
-
34
-
35
-
36
-
37
-
38
-
39
-
40
-
41
-
42
-
43
-
44
-
45
-
46
-
47
-
48
-
49
-
50
-
51
-
52
-
53
-
54
-
55
-
56
-
57
-
58
-
59
-
60
-
61
-
62
-
63
-
64
-
65
-
66
-
67
-
68
-
69
-
70
-
71
-
72
-
73
-
74
-
75
-
76
-
77
-
78
-
79
-
80
-
81
-
82
-
83
-
84
-
85
-
86
-
87
-
 88
88 -
 89
89 -
 90
90 -
 91
91 -
 92
92 -
 93
93 -
 94
94 -
 95
95 -
 96
96 -
 97
97 -
 98
98 -
 99
99 -
 100
100 -
 101
101 -
 102
102 -
 103
103 -
 104
104 -
 105
105 -
 106
106 -
 107
107 -
 108
108 -
109
-
110
-
111
-
112
-
113
-
114
-
115
-
116
-
117
-
118
-
119
-
120
-
121
-
122
-
123
-
124
-
125
-
126
-
127
-
128
-
129
-
130
-
131
-
132
-
133
-
134
-
135
-
136
-
137
-
138
-
139
-
140
-
141
-
142
-
143
-
144
-
145
-
146
-
147
-
148
-
149
-
150
-
151
-
152
-
153
-
154
-
155
-
156
-
157
-
158
-
159
-
160
-
161
-
162
-
163
-
164
-
165
-
166
-
167
-
168
-
169
-
170
-
171
-
172
-
173
-
174
-
175
-
176
-
177
-
178
-
179
-
180
-
181
-
182
-
183
-
184
-
185
-
186
-
187
-
188
-
189
-
190
-
191
-
192
-
193
-
194
-
195
-
196
-
197
-
198
-
199
-
200
-
201
-
202
-
203
-
204
-
205
-
206
-
207
-
208
-
209
-
210
-
211
-
212
-
213
-
214
-
215
-
216
-
217
-
218
-
219
-
220
-
221
-
222
-
223
-
224
-
225
-
226
-
227
-
228
-
229
-
230
-
231
-
232
-
233
-
234
-
235
-
236
-
237
-
238
-
239
-
240
-
241
-
242
-
243
-
244
-
245
-
246
-
247
-
248
-
249
-
250
-
251
-
252
-
253
-
254
-
255
-
256
-
257
-
258
-
259
-
260
-
261
-
262
-
263
-
264
-
265
-
266
-
267
-
268
-
269
-
270
-
271
-
272
-
273
-
274
-
275
-
276
-
277
-
278
-
279
-
280
-
281
-
282
-
283
-
284
-
285
-
286
 |
 |

HONEYWELL INTERNATIONAL INC.
NOTES TO FINANCIAL STATEMENTS—(Continued)
(Dollars in millions, except per share amounts)
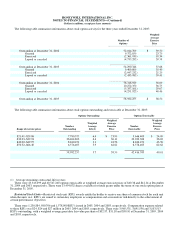
The following table summarizes information about stock option activity for the three years ended December 31, 2005:
Number of
Options
Weighted
Average
Exercise
Price
Outstanding at December 31, 2002 52,014,709 $ 39.50
Granted 9,372,850 23.70
Exercised (2,361,930) 18.34
Lapsed or canceled (4,735,283) 39.58
Outstanding at December 31, 2003 54,290,346 37.68
Granted 9,409,800 35.49
Exercised (2,947,232) 21.20
Lapsed or canceled (2,433,985) 39.41
Outstanding at December 31, 2004 58,318,929 38.09
Granted 10,272,350 36.75
Exercised (5,357,101) 29.07
Lapsed or canceled (4,251,923) 40.46
Outstanding at December 31, 2005 58,982,255 $ 38.50
The following table summarizes information about stock options outstanding and exercisable at December 31, 2005:
Options Outstanding Options Exercisable
Range of exercise prices
Number
Outstanding
Weighted
Average
Life(1)
Weighted
Average
Exercise
Price
Number
Exercisable
Weighted
Average
Exercise
Price
$21.41–$29.86 7,780,575 6.4 $ 23.99 5,646,405 $ 24.09
$30.03–$39.94 36,464,806 6.4 36.12 22,033,306 36.02
$40.02–$49.97 8,160,471 3.1 43.56 8,160,471 43.56
$50.32–$66.40 6,576,403 3.9 62.62 6,576,403 62.62
58,982,255 5.7 38.50 42,416,585 40.01
(1) Average remaining contractual life in years.
There were 43,343,099 and 40,547,240 options exercisable at weighted average exercise prices of $40.36 and $41.14 at December
31, 2004 and 2003, respectively. There were 13,454,032 shares available for future grants under the terms of our stock option plans at
December 31, 2005.
Restricted Stock Units—Restricted stock unit (RSU) awards entitle the holder to receive one share of common stock for each unit
when the units vest. RSU's are issued to certain key employees as compensation and as incentives tied directly to the achievement of
certain performance objectives.
There were 1,230,884, 980,706 and 1,578,000 RSU's issued in 2005, 2004 and 2003, respectively. Compensation expense related
to these RSUs was $24, $24 and $27 million in 2005, 2004 and 2003, respectively. There were 3,965,531, 3,691,556 and 3,103,513
RSU's outstanding, with a weighted average grant date fair value per share of $32.97, $31.18 and $30.10 at December 31, 2005, 2004
and 2003, respectively.