Honeywell 2005 Annual Report Download - page 79
Download and view the complete annual report
Please find page 79 of the 2005 Honeywell annual report below. You can navigate through the pages in the report by either clicking on the pages listed below, or by using the keyword search tool below to find specific information within the annual report.-
 1
1 -
2
-
3
-
4
-
5
-
6
-
7
-
8
-
9
-
10
-
11
-
12
-
13
-
14
-
15
-
16
-
17
-
18
-
19
-
20
-
21
-
22
-
23
-
24
-
25
-
26
-
27
-
28
-
29
-
30
-
31
-
32
-
33
-
34
-
35
-
36
-
37
-
38
-
39
-
40
-
41
-
42
-
43
-
44
-
45
-
46
-
47
-
48
-
49
-
50
-
51
-
52
-
53
-
54
-
55
-
56
-
57
-
58
-
59
-
60
-
61
-
62
-
63
-
64
-
65
-
66
-
67
-
68
-
 69
69 -
 70
70 -
 71
71 -
 72
72 -
 73
73 -
 74
74 -
 75
75 -
 76
76 -
 77
77 -
 78
78 -
 79
79 -
 80
80 -
 81
81 -
 82
82 -
 83
83 -
 84
84 -
 85
85 -
 86
86 -
 87
87 -
 88
88 -
 89
89 -
90
-
91
-
92
-
93
-
94
-
95
-
96
-
97
-
98
-
99
-
100
-
101
-
102
-
103
-
104
-
105
-
106
-
107
-
108
-
109
-
110
-
111
-
112
-
113
-
114
-
115
-
116
-
117
-
118
-
119
-
120
-
121
-
122
-
123
-
124
-
125
-
126
-
127
-
128
-
129
-
130
-
131
-
132
-
133
-
134
-
135
-
136
-
137
-
138
-
139
-
140
-
141
-
142
-
143
-
144
-
145
-
146
-
147
-
148
-
149
-
150
-
151
-
152
-
153
-
154
-
155
-
156
-
157
-
158
-
159
-
160
-
161
-
162
-
163
-
164
-
165
-
166
-
167
-
168
-
169
-
170
-
171
-
172
-
173
-
174
-
175
-
176
-
177
-
178
-
179
-
180
-
181
-
182
-
183
-
184
-
185
-
186
-
187
-
188
-
189
-
190
-
191
-
192
-
193
-
194
-
195
-
196
-
197
-
198
-
199
-
200
-
201
-
202
-
203
-
204
-
205
-
206
-
207
-
208
-
209
-
210
-
211
-
212
-
213
-
214
-
215
-
216
-
217
-
218
-
219
-
220
-
221
-
222
-
223
-
224
-
225
-
226
-
227
-
228
-
229
-
230
-
231
-
232
-
233
-
234
-
235
-
236
-
237
-
238
-
239
-
240
-
241
-
242
-
243
-
244
-
245
-
246
-
247
-
248
-
249
-
250
-
251
-
252
-
253
-
254
-
255
-
256
-
257
-
258
-
259
-
260
-
261
-
262
-
263
-
264
-
265
-
266
-
267
-
268
-
269
-
270
-
271
-
272
-
273
-
274
-
275
-
276
-
277
-
278
-
279
-
280
-
281
-
282
-
283
-
284
-
285
-
286
 |
 |

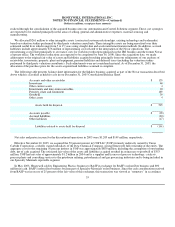
HONEYWELL INTERNATIONAL INC.
NOTES TO FINANCIAL STATEMENTS—(Continued)
(Dollars in millions, except per share amounts)
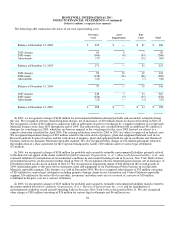
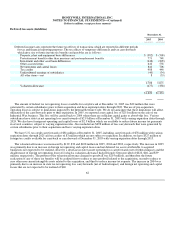
Specialty Materials reportable segment including a loss on sale of an investment owned by an equity investee.
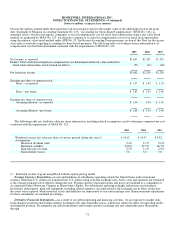
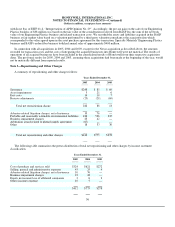
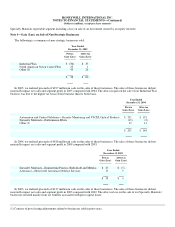
Note 4—Gain (Loss) on Sale of Non-Strategic Businesses
The following is a summary of non-strategic businesses sold:
Year Ended
December 31, 2005
Pretax
Gain (Loss) After-tax
Gain (Loss)
Industrial Wax $ (30) $ 33
North American Nylon Carpet Fiber 23 1
Other (1) 43 26
$ 36 $ 60
In 2005, we realized proceeds of $197 million in cash on the sales of these businesses. The sales of these businesses did not
materially impact net sales and segment profit in 2005 compared with 2004. The after-tax gain on the sale of our Industrial Wax
business was due to the higher tax basis of this business than its book basis.
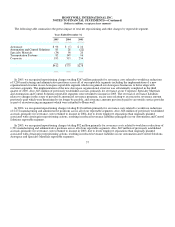
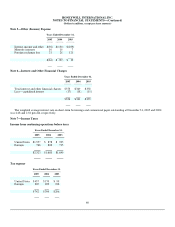
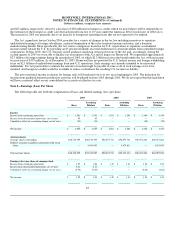
Year Ended
December 31, 2004
Pretax
Gain (Loss) After-tax
Gain (Loss)
Automation and Control Solutions—Security Monitoring and VSCEL Optical Products $ 251 $ 133
Specialty Materials—Performance Fibers (15) (3)
Other (1) 19 14
$ 255 $ 144
In 2004, we realized proceeds of $426 million in cash on the sales of these businesses. The sales of these businesses did not
materially impact net sales and segment profit in 2004 compared with 2003.
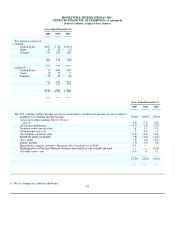
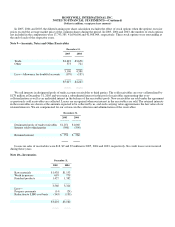
Year Ended
December 31, 2003
Pretax
Gain (Loss) After-tax
Gain (Loss)
Specialty Materials—Engineering Plastics, Rudolstadt and Metglas $ 25 $ (5)
Aerospace—Honeywell Aerospace Defense Services 13 9
$ 38 $ 4
In 2003, we realized proceeds of $137 million in cash on the sales of these businesses. The sales of these businesses did not
materially impact net sales and segment profit in 2003 compared with 2002. The after-tax loss on the sale of our Specialty Materials'
businesses resulted mainly from tax benefits associated with prior capital losses.
(1) Consists of post closing adjustments related to businesses sold in prior years.