Honeywell 2005 Annual Report Download - page 70
Download and view the complete annual report
Please find page 70 of the 2005 Honeywell annual report below. You can navigate through the pages in the report by either clicking on the pages listed below, or by using the keyword search tool below to find specific information within the annual report.-
 1
1 -
2
-
3
-
4
-
5
-
6
-
7
-
8
-
9
-
10
-
11
-
12
-
13
-
14
-
15
-
16
-
17
-
18
-
19
-
20
-
21
-
22
-
23
-
24
-
25
-
26
-
27
-
28
-
29
-
30
-
31
-
32
-
33
-
34
-
35
-
36
-
37
-
38
-
39
-
40
-
41
-
42
-
43
-
44
-
45
-
46
-
47
-
48
-
49
-
50
-
51
-
52
-
53
-
54
-
55
-
56
-
57
-
58
-
59
-
 60
60 -
 61
61 -
 62
62 -
 63
63 -
 64
64 -
 65
65 -
 66
66 -
 67
67 -
 68
68 -
 69
69 -
 70
70 -
 71
71 -
 72
72 -
 73
73 -
 74
74 -
 75
75 -
 76
76 -
 77
77 -
 78
78 -
 79
79 -
 80
80 -
81
-
82
-
83
-
84
-
85
-
86
-
87
-
88
-
89
-
90
-
91
-
92
-
93
-
94
-
95
-
96
-
97
-
98
-
99
-
100
-
101
-
102
-
103
-
104
-
105
-
106
-
107
-
108
-
109
-
110
-
111
-
112
-
113
-
114
-
115
-
116
-
117
-
118
-
119
-
120
-
121
-
122
-
123
-
124
-
125
-
126
-
127
-
128
-
129
-
130
-
131
-
132
-
133
-
134
-
135
-
136
-
137
-
138
-
139
-
140
-
141
-
142
-
143
-
144
-
145
-
146
-
147
-
148
-
149
-
150
-
151
-
152
-
153
-
154
-
155
-
156
-
157
-
158
-
159
-
160
-
161
-
162
-
163
-
164
-
165
-
166
-
167
-
168
-
169
-
170
-
171
-
172
-
173
-
174
-
175
-
176
-
177
-
178
-
179
-
180
-
181
-
182
-
183
-
184
-
185
-
186
-
187
-
188
-
189
-
190
-
191
-
192
-
193
-
194
-
195
-
196
-
197
-
198
-
199
-
200
-
201
-
202
-
203
-
204
-
205
-
206
-
207
-
208
-
209
-
210
-
211
-
212
-
213
-
214
-
215
-
216
-
217
-
218
-
219
-
220
-
221
-
222
-
223
-
224
-
225
-
226
-
227
-
228
-
229
-
230
-
231
-
232
-
233
-
234
-
235
-
236
-
237
-
238
-
239
-
240
-
241
-
242
-
243
-
244
-
245
-
246
-
247
-
248
-
249
-
250
-
251
-
252
-
253
-
254
-
255
-
256
-
257
-
258
-
259
-
260
-
261
-
262
-
263
-
264
-
265
-
266
-
267
-
268
-
269
-
270
-
271
-
272
-
273
-
274
-
275
-
276
-
277
-
278
-
279
-
280
-
281
-
282
-
283
-
284
-
285
-
286
 |
 |
HONEYWELL INTERNATIONAL INC.
NOTES TO FINANCIAL STATEMENTS—(Continued)
(Dollars in millions, except per share amounts)
because the options granted under these plans have an exercise price equal to the market value of the underlying stock at the grant
date. Statement of Financial Accounting Standards No. 123, “Accounting for Stock-Based Compensation” (SFAS No. 123), as
amended, allows, but does not require, companies to record compensation cost for fixed stock option plans using a fair value based
method. As permitted by SFAS No. 123, we elected to continue to account for compensation cost for our fixed stock option plans
using the intrinsic value based method under APB No. 25. See Recent Accounting Pronouncements section of this Note for discussion
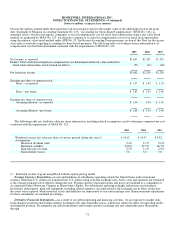
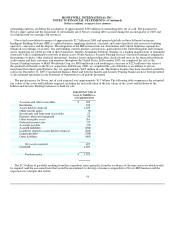
of recently issued rules regarding accounting for share-based payments. The following table sets forth pro forma information as if
compensation cost had been determined consistent with the requirements of SFAS No. 123.
2005 2004 2003
Net income, as reported $1,655 $1,281 $1,324
Deduct: Total stock-based employee compensation cost determined under fair value method for
fixed stock option plans, net of related tax effects (53) (42) (48)
Pro forma net income $1,602 $1,239 $1,276
Earnings per share of common stock:
Basic—as reported $ 1.95 $ 1.49 $ 1.54
Basic—pro forma $ 1.89 $ 1.44 $ 1.48
Earnings per share of common stock:
Assuming dilution—as reported $ 1.94 1.49 $ 1.54
Assuming dilution—pro forma $ 1.88 $ 1.44 $ 1.48
The following table sets forth fair value per share information, including related assumptions, used to determine compensation cost
consistent with the requirements of SFAS No. 123.
2005 2004 2003
Weighted average fair value per share of options granted during the year(1) $ 10.67 $ 10.97 $ 8.82
Assumptions:
Historical dividend yield 2.4% 2.1% 2.0%
Historical volatility 34.8% 37.9% 46.7%
Risk-free rate of return 3.7% 3.3% 2.9%
Expected life (years) 5.0 5.0 5.0
(1) Estimated on date of grant using Black-Scholes option-pricing model.
Foreign Currency Translation—Assets and liabilities of subsidiaries operating outside the United States with a functional
currency other than U.S. dollars are translated into U.S. dollars using year-end exchange rates. Sales, costs and expenses are translated
at the average exchange rates effective during the year. Foreign currency translation gains and losses are included as a component of
Accumulated Other Nonowner Changes in Shareowners' Equity. For subsidiaries operating in highly inflationary environments,
inventories and property, plant and equipment, including related expenses, are remeasured at the exchange rate in effect on the date
the assets were acquired, while monetary assets and liabilities are remeasured at year-end exchange rates. Remeasurement adjustments
for these subsidiaries are included in earnings.
Derivative Financial Instruments—As a result of our global operating and financing activities, we are exposed to market risks
from changes in interest and foreign currency exchange rates and commodity prices, which may adversely affect our operating results
and financial position. We minimize our risks from interest and foreign currency exchange rate and commodity price fluctuations
through
51