Honeywell 2005 Annual Report Download - page 114
Download and view the complete annual report
Please find page 114 of the 2005 Honeywell annual report below. You can navigate through the pages in the report by either clicking on the pages listed below, or by using the keyword search tool below to find specific information within the annual report.-
 1
1 -
2
-
3
-
4
-
5
-
6
-
7
-
8
-
9
-
10
-
11
-
12
-
13
-
14
-
15
-
16
-
17
-
18
-
19
-
20
-
21
-
22
-
23
-
24
-
25
-
26
-
27
-
28
-
29
-
30
-
31
-
32
-
33
-
34
-
35
-
36
-
37
-
38
-
39
-
40
-
41
-
42
-
43
-
44
-
45
-
46
-
47
-
48
-
49
-
50
-
51
-
52
-
53
-
54
-
55
-
56
-
57
-
58
-
59
-
60
-
61
-
62
-
63
-
64
-
65
-
66
-
67
-
68
-
69
-
70
-
71
-
72
-
73
-
74
-
75
-
76
-
77
-
78
-
79
-
80
-
81
-
82
-
83
-
84
-
85
-
86
-
87
-
88
-
89
-
90
-
91
-
92
-
93
-
94
-
95
-
96
-
97
-
98
-
99
-
100
-
101
-
102
-
103
-
 104
104 -
 105
105 -
 106
106 -
 107
107 -
 108
108 -
 109
109 -
 110
110 -
 111
111 -
 112
112 -
 113
113 -
 114
114 -
 115
115 -
 116
116 -
 117
117 -
 118
118 -
 119
119 -
 120
120 -
 121
121 -
 122
122 -
 123
123 -
 124
124 -
125
-
126
-
127
-
128
-
129
-
130
-
131
-
132
-
133
-
134
-
135
-
136
-
137
-
138
-
139
-
140
-
141
-
142
-
143
-
144
-
145
-
146
-
147
-
148
-
149
-
150
-
151
-
152
-
153
-
154
-
155
-
156
-
157
-
158
-
159
-
160
-
161
-
162
-
163
-
164
-
165
-
166
-
167
-
168
-
169
-
170
-
171
-
172
-
173
-
174
-
175
-
176
-
177
-
178
-
179
-
180
-
181
-
182
-
183
-
184
-
185
-
186
-
187
-
188
-
189
-
190
-
191
-
192
-
193
-
194
-
195
-
196
-
197
-
198
-
199
-
200
-
201
-
202
-
203
-
204
-
205
-
206
-
207
-
208
-
209
-
210
-
211
-
212
-
213
-
214
-
215
-
216
-
217
-
218
-
219
-
220
-
221
-
222
-
223
-
224
-
225
-
226
-
227
-
228
-
229
-
230
-
231
-
232
-
233
-
234
-
235
-
236
-
237
-
238
-
239
-
240
-
241
-
242
-
243
-
244
-
245
-
246
-
247
-
248
-
249
-
250
-
251
-
252
-
253
-
254
-
255
-
256
-
257
-
258
-
259
-
260
-
261
-
262
-
263
-
264
-
265
-
266
-
267
-
268
-
269
-
270
-
271
-
272
-
273
-
274
-
275
-
276
-
277
-
278
-
279
-
280
-
281
-
282
-
283
-
284
-
285
-
286
 |
 |

HONEYWELL INTERNATIONAL INC.
NOTES TO FINANCIAL STATEMENTS—(Continued)
(Dollars in millions, except per share amounts)
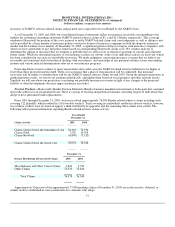
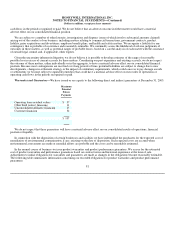
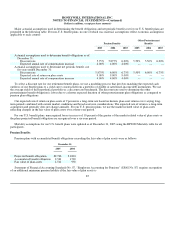
Major actuarial assumptions used in determining the benefit obligations and net periodic benefit cost for our U.S. benefit plans are
presented in the following table. For non-U.S. benefit plans, no one of which was material, assumptions reflect economic assumptions
applicable to each country.
Pension Benefits Other Postretirement
Benefits
2005 2004 2003 2005 2004 2003
Actuarial assumptions used to determine benefit obligations as of
December 31:
Discount rate 5.75% 5.875% 6.00% 5.50% 5.50% 6.00%
Expected annual rate of compensation increase 4.00% 4.00% 4.00% — — —
Actuarial assumptions used to determine net periodic benefit cost
for years ended December 31:
Discount rate 5.875% 6.00% 6.75% 5.50% 6.00% 6.75%
Expected rate of return on plan assets 9.00% 9.00% 9.00% — — —
Expected annual rate of compensation increase 4.00% 4.00% 4.00% — — —
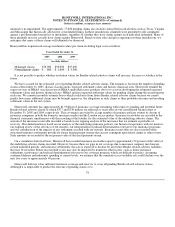
To select a discount rate for our retirement benefit plans, we use a modeling process that involves matching the expected cash
outflows of our benefit plans to a yield curve constructed from a portfolio of double A rated fixed-income debt instruments. We use
the average yield of this hypothetical portfolio as a discount rate benchmark. The discount rate used to determine the other
postretirement benefit obligation is lower due to a shorter expected duration of other postretirement plan obligations as compared to
pension plan obligations.
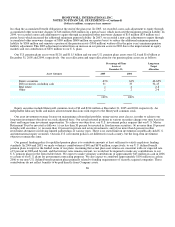
Our expected rate of return on plan assets of 9 percent is a long-term rate based on historic plan asset returns over varying long-
term periods combined with current market conditions and broad asset mix considerations. The expected rate of return is a long-term
assumption and generally does not change annually. For our U.S. pension plans, we use the market-related value of plan assets
reflecting changes in the fair value of plan assets over a three-year period.
For our U.S. benefit plans, unrecognized losses in excess of 10 percent of the greater of the market-related value of plan assets or
the plans projected benefit obligation are recognized over a six-year period.
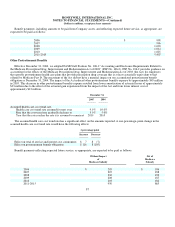
Mortality assumptions for our U.S. benefit plans were updated as of December 31, 2005 using the RP2000 Mortality table for all
participants.
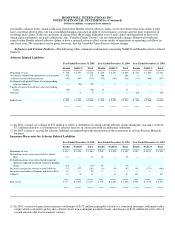
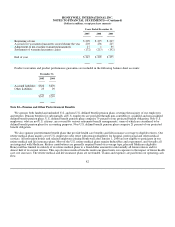
Pension Benefits
Pension plans with accumulated benefit obligations exceeding the fair value of plan assets were as follows:
December 31,
2005 2004
Projected benefit obligation $2,746 $1,801
Accumulated benefit obligation 2,541 1,720
Fair value of plan assets 1,511 950
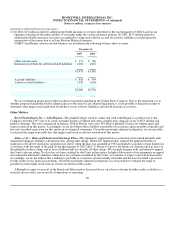
Statement of Financial Accounting Standards No. 87, “Employers Accounting for Pensions” (SFAS No. 87) requires recognition
of an additional minimum pension liability if the fair value of plan assets is
85