Honeywell 2005 Annual Report Download - page 43
Download and view the complete annual report
Please find page 43 of the 2005 Honeywell annual report below. You can navigate through the pages in the report by either clicking on the pages listed below, or by using the keyword search tool below to find specific information within the annual report.-
 1
1 -
2
-
3
-
4
-
5
-
6
-
7
-
8
-
9
-
10
-
11
-
12
-
13
-
14
-
15
-
16
-
17
-
18
-
19
-
20
-
21
-
22
-
23
-
24
-
25
-
26
-
27
-
28
-
29
-
30
-
31
-
32
-
 33
33 -
 34
34 -
 35
35 -
 36
36 -
 37
37 -
 38
38 -
 39
39 -
 40
40 -
 41
41 -
 42
42 -
 43
43 -
 44
44 -
 45
45 -
 46
46 -
 47
47 -
 48
48 -
 49
49 -
 50
50 -
 51
51 -
 52
52 -
 53
53 -
54
-
55
-
56
-
57
-
58
-
59
-
60
-
61
-
62
-
63
-
64
-
65
-
66
-
67
-
68
-
69
-
70
-
71
-
72
-
73
-
74
-
75
-
76
-
77
-
78
-
79
-
80
-
81
-
82
-
83
-
84
-
85
-
86
-
87
-
88
-
89
-
90
-
91
-
92
-
93
-
94
-
95
-
96
-
97
-
98
-
99
-
100
-
101
-
102
-
103
-
104
-
105
-
106
-
107
-
108
-
109
-
110
-
111
-
112
-
113
-
114
-
115
-
116
-
117
-
118
-
119
-
120
-
121
-
122
-
123
-
124
-
125
-
126
-
127
-
128
-
129
-
130
-
131
-
132
-
133
-
134
-
135
-
136
-
137
-
138
-
139
-
140
-
141
-
142
-
143
-
144
-
145
-
146
-
147
-
148
-
149
-
150
-
151
-
152
-
153
-
154
-
155
-
156
-
157
-
158
-
159
-
160
-
161
-
162
-
163
-
164
-
165
-
166
-
167
-
168
-
169
-
170
-
171
-
172
-
173
-
174
-
175
-
176
-
177
-
178
-
179
-
180
-
181
-
182
-
183
-
184
-
185
-
186
-
187
-
188
-
189
-
190
-
191
-
192
-
193
-
194
-
195
-
196
-
197
-
198
-
199
-
200
-
201
-
202
-
203
-
204
-
205
-
206
-
207
-
208
-
209
-
210
-
211
-
212
-
213
-
214
-
215
-
216
-
217
-
218
-
219
-
220
-
221
-
222
-
223
-
224
-
225
-
226
-
227
-
228
-
229
-
230
-
231
-
232
-
233
-
234
-
235
-
236
-
237
-
238
-
239
-
240
-
241
-
242
-
243
-
244
-
245
-
246
-
247
-
248
-
249
-
250
-
251
-
252
-
253
-
254
-
255
-
256
-
257
-
258
-
259
-
260
-
261
-
262
-
263
-
264
-
265
-
266
-
267
-
268
-
269
-
270
-
271
-
272
-
273
-
274
-
275
-
276
-
277
-
278
-
279
-
280
-
281
-
282
-
283
-
284
-
285
-
286
 |
 |

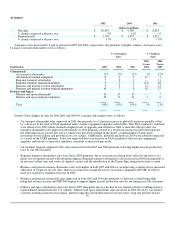
• Defense and space OE sales increased in both 2005 and 2004 due principally to platform upgrades related to war-related
activities, growth in precision munitions and increases in restricted space programs.
Aerospace segment profit in 2005 increased by 15 percent compared with 2004 due primarily to volume growth and the effect of
productivity actions, partially offset by an increase in spending for information technology systems. Aerospace segment profit in 2004
increased by 21 percent compared with 2003 due primarily to volume growth partially offset by higher development expense
associated with new programs and an increase in spending for information technology systems.
Trends which may impact Aerospace operating results in 2006 include:
• Global flying hours improved by 7 percent in 2005 and are expected to increase again in 2006 (5 to 6 percent).
• The financial condition of major commercial airlines continues to be a concern due mainly to high fuel costs and intense fare
competition.
• The level and mix of U.S. government appropriations for defense and space programs and the nature and level of war-related
activities.
• Aircraft production rates and delivery schedules in the air transport, business and general aviation end-markets.
• The impact of global economic conditions on utilization of business jet and general aviation aircraft.
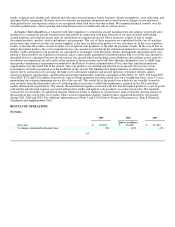
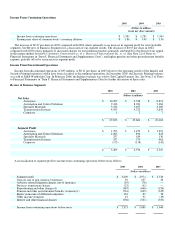
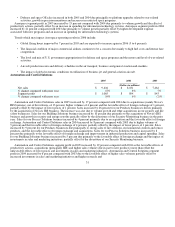
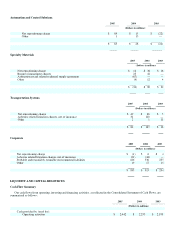
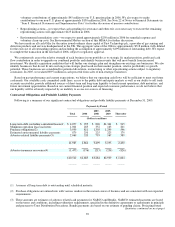
Automation and Control Solutions
2005 2004 2003
(Dollars in millions)
Net sales $ 9,416 $ 8,031 $ 7,464
% change compared with prior year 17% 8% 7%
Segment profit $ 1,065 $ 894 $ 843
% change compared with prior year 19% 6% (2)%
Automation and Control Solutions sales in 2005 increased by 17 percent compared with 2004 due to acquisitions (mainly Novar's
IBS business), net of divestitures, of 13 percent, higher volumes of 4 percent and the favorable effect of foreign exchange of 1 percent,
partially offset by the impact of lower prices of 1 percent. Sales increased by 26 percent for our Products businesses driven primarily
by the acquisition of Novar's IBS business. The increase was also due to volume growth and other acquisitions in our security and life
safety businesses. Sales for our Building Solutions business increased by 10 percent due primarily to the acquisition of Novar's IBS
business and growth in security and energy retrofits partially offset by the divestiture of our Security Monitoring business in the prior
year. Sales for our Process Solutions business increased by 4 percent primarily due to an acquisition and the favorable effect of foreign
exchange. Automation and Control Solutions sales in 2004 increased by 8 percent compared with 2003 due to higher volumes of
5 percent and the favorable effect of foreign exchange of 4 percent, partially offset by the impact of lower prices of 1 percent. Sales
increased by 9 percent for our Products businesses due principally to strong sales of fire solutions, environmental controls and sensor
products, and the favorable effects of foreign exchange and acquisitions. Sales for our Process Solutions business increased by 8
percent due primarily to the favorable effect of foreign exchange and improvement in industrial production and capital spending. Sales
for our Building Solutions business increased by 5 percent due primarily to the favorable effect of foreign exchange and the impact of
investments in sales and marketing initiatives, partially offset by the divestiture of our Security Monitoring business.
Automation and Control Solutions segment profit in 2005 increased by 19 percent compared with 2004 as the favorable effects of
productivity actions, acquisitions (principally IBS) and higher sales volume (due in part to new products) more than offset the
unfavorable effects of lower prices and investments in sales and marketing initiatives. Automation and Control Solutions segment
profit in 2004 increased by 6 percent compared with 2003 due to the favorable effect of higher sales volumes partially offset by
increased investments in sales and marketing initiatives and higher research and
31