Honeywell 2005 Annual Report Download - page 36
Download and view the complete annual report
Please find page 36 of the 2005 Honeywell annual report below. You can navigate through the pages in the report by either clicking on the pages listed below, or by using the keyword search tool below to find specific information within the annual report.-
 1
1 -
2
-
3
-
4
-
5
-
6
-
7
-
8
-
9
-
10
-
11
-
12
-
13
-
14
-
15
-
16
-
17
-
18
-
19
-
20
-
21
-
22
-
23
-
24
-
25
-
 26
26 -
 27
27 -
 28
28 -
 29
29 -
 30
30 -
 31
31 -
 32
32 -
 33
33 -
 34
34 -
 35
35 -
 36
36 -
 37
37 -
 38
38 -
 39
39 -
 40
40 -
 41
41 -
 42
42 -
 43
43 -
 44
44 -
 45
45 -
 46
46 -
47
-
48
-
49
-
50
-
51
-
52
-
53
-
54
-
55
-
56
-
57
-
58
-
59
-
60
-
61
-
62
-
63
-
64
-
65
-
66
-
67
-
68
-
69
-
70
-
71
-
72
-
73
-
74
-
75
-
76
-
77
-
78
-
79
-
80
-
81
-
82
-
83
-
84
-
85
-
86
-
87
-
88
-
89
-
90
-
91
-
92
-
93
-
94
-
95
-
96
-
97
-
98
-
99
-
100
-
101
-
102
-
103
-
104
-
105
-
106
-
107
-
108
-
109
-
110
-
111
-
112
-
113
-
114
-
115
-
116
-
117
-
118
-
119
-
120
-
121
-
122
-
123
-
124
-
125
-
126
-
127
-
128
-
129
-
130
-
131
-
132
-
133
-
134
-
135
-
136
-
137
-
138
-
139
-
140
-
141
-
142
-
143
-
144
-
145
-
146
-
147
-
148
-
149
-
150
-
151
-
152
-
153
-
154
-
155
-
156
-
157
-
158
-
159
-
160
-
161
-
162
-
163
-
164
-
165
-
166
-
167
-
168
-
169
-
170
-
171
-
172
-
173
-
174
-
175
-
176
-
177
-
178
-
179
-
180
-
181
-
182
-
183
-
184
-
185
-
186
-
187
-
188
-
189
-
190
-
191
-
192
-
193
-
194
-
195
-
196
-
197
-
198
-
199
-
200
-
201
-
202
-
203
-
204
-
205
-
206
-
207
-
208
-
209
-
210
-
211
-
212
-
213
-
214
-
215
-
216
-
217
-
218
-
219
-
220
-
221
-
222
-
223
-
224
-
225
-
226
-
227
-
228
-
229
-
230
-
231
-
232
-
233
-
234
-
235
-
236
-
237
-
238
-
239
-
240
-
241
-
242
-
243
-
244
-
245
-
246
-
247
-
248
-
249
-
250
-
251
-
252
-
253
-
254
-
255
-
256
-
257
-
258
-
259
-
260
-
261
-
262
-
263
-
264
-
265
-
266
-
267
-
268
-
269
-
270
-
271
-
272
-
273
-
274
-
275
-
276
-
277
-
278
-
279
-
280
-
281
-
282
-
283
-
284
-
285
-
286
 |
 |

trends, technical and schedule risk, internal and subcontractor performance trends, business volume assumptions, asset utilization, and
anticipated labor agreements. Revenue and cost estimates are regularly monitored and revised based on changes in circumstances.
Anticipated losses on long-term contracts are recognized when such losses become evident. We maintain financial controls over the
customer qualification, contract pricing and estimation processes to reduce the risk of contract losses.
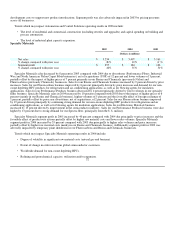
Aerospace Sales Incentives—Consistent with other suppliers to commercial aircraft manufacturers and airlines, we provide sales
incentives to commercial aircraft manufacturers and airlines in connection with their selection of our aircraft wheel and braking
system hardware and auxiliary power units for installation on commercial aircraft. These incentives consist of free or deeply
discounted products, product credits and upfront cash payments. The cost of these incentives are capitalized (in the case of auxiliary
power units only when we are the sole source supplier) at the time we deliver the products to our customers or, in the case of product
credits, at the time the credit is issued, or in the case of upfront cash payments, at the time the payment is made. In the case of free or
deeply discounted product, the cost to manufacture less any amount recovered from the airframe manufacturer or airline is capitalized.
Product credits and upfront cash payments are capitalized at exchanged value. Research, design, development and qualification costs
related to these products are expensed as incurred, unless contractually guaranteed of reimbursement. The cost of the sales incentives
described above is capitalized because the selection of our aircraft wheel and braking system hardware and auxiliary power units for
installation on commercial aircraft results in the creation of future revenues and cash flows through aftermarket sales to fulfill long-
term product maintenance requirements mandated by the Federal Aviation Administration (FAA) and other similar international
organizations over the useful life of the aircraft. Once our products are certified and selected on an aircraft, the recovery of our
investment is virtually guaranteed over the useful life of the aircraft. The likelihood of displacement by an alternative supplier is
remote due to contractual sole-sourcing, the high cost to alternative suppliers and aircraft operators of product retrofits, and/or
rigorous regulatory specifications, qualification and testing requirements. Amounts capitalized at December 31, 2005, 2004 and 2003
were $803, $776 and $719 million, respectively, and are being amortized over their useful lives on a straight-line basis, up to 25 years,
representing the estimated minimum service life of the aircraft. This useful life is the period over which we are virtually assured to
earn revenues from the aftermarket sales of certified products necessary to fulfill the maintenance required by the FAA and other
similar international organizations. We classify the amortization expense associated with free and discounted products as cost of goods
sold and the amortization expense associated with product credits and upfront cash payments as a reduction of sales. We regularly
evaluate the recoverability of capitalized amounts whenever events or changes in circumstances indicate that the carrying amount of
the incentives may not be fully recoverable. There were no impairment charges related to these capitalized incentives recognized
during 2005, 2004 and 2003. For additional information see Notes 1 and 13 of Notes to Financial Statements in “Item 8. Financial
Statements and Supplementary Data.”
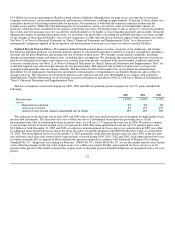
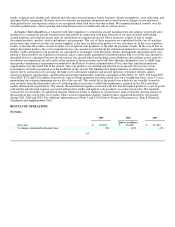
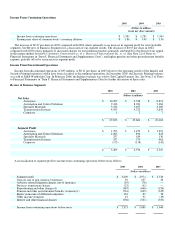
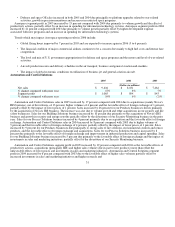
RESULTS OF OPERATIONS
Net Sales
2005 2004 2003
(Dollars in millions)
Net sales $ 27,653 $ 25,601 $ 23,103
% change compared with prior year 8% 11% 4%
25