Honeywell 2005 Annual Report Download - page 51
Download and view the complete annual report
Please find page 51 of the 2005 Honeywell annual report below. You can navigate through the pages in the report by either clicking on the pages listed below, or by using the keyword search tool below to find specific information within the annual report.-
 1
1 -
2
-
3
-
4
-
5
-
6
-
7
-
8
-
9
-
10
-
11
-
12
-
13
-
14
-
15
-
16
-
17
-
18
-
19
-
20
-
21
-
22
-
23
-
24
-
25
-
26
-
27
-
28
-
29
-
30
-
31
-
32
-
33
-
34
-
35
-
36
-
37
-
38
-
39
-
40
-
 41
41 -
 42
42 -
 43
43 -
 44
44 -
 45
45 -
 46
46 -
 47
47 -
 48
48 -
 49
49 -
 50
50 -
 51
51 -
 52
52 -
 53
53 -
 54
54 -
 55
55 -
 56
56 -
 57
57 -
 58
58 -
 59
59 -
 60
60 -
 61
61 -
62
-
63
-
64
-
65
-
66
-
67
-
68
-
69
-
70
-
71
-
72
-
73
-
74
-
75
-
76
-
77
-
78
-
79
-
80
-
81
-
82
-
83
-
84
-
85
-
86
-
87
-
88
-
89
-
90
-
91
-
92
-
93
-
94
-
95
-
96
-
97
-
98
-
99
-
100
-
101
-
102
-
103
-
104
-
105
-
106
-
107
-
108
-
109
-
110
-
111
-
112
-
113
-
114
-
115
-
116
-
117
-
118
-
119
-
120
-
121
-
122
-
123
-
124
-
125
-
126
-
127
-
128
-
129
-
130
-
131
-
132
-
133
-
134
-
135
-
136
-
137
-
138
-
139
-
140
-
141
-
142
-
143
-
144
-
145
-
146
-
147
-
148
-
149
-
150
-
151
-
152
-
153
-
154
-
155
-
156
-
157
-
158
-
159
-
160
-
161
-
162
-
163
-
164
-
165
-
166
-
167
-
168
-
169
-
170
-
171
-
172
-
173
-
174
-
175
-
176
-
177
-
178
-
179
-
180
-
181
-
182
-
183
-
184
-
185
-
186
-
187
-
188
-
189
-
190
-
191
-
192
-
193
-
194
-
195
-
196
-
197
-
198
-
199
-
200
-
201
-
202
-
203
-
204
-
205
-
206
-
207
-
208
-
209
-
210
-
211
-
212
-
213
-
214
-
215
-
216
-
217
-
218
-
219
-
220
-
221
-
222
-
223
-
224
-
225
-
226
-
227
-
228
-
229
-
230
-
231
-
232
-
233
-
234
-
235
-
236
-
237
-
238
-
239
-
240
-
241
-
242
-
243
-
244
-
245
-
246
-
247
-
248
-
249
-
250
-
251
-
252
-
253
-
254
-
255
-
256
-
257
-
258
-
259
-
260
-
261
-
262
-
263
-
264
-
265
-
266
-
267
-
268
-
269
-
270
-
271
-
272
-
273
-
274
-
275
-
276
-
277
-
278
-
279
-
280
-
281
-
282
-
283
-
284
-
285
-
286
 |
 |

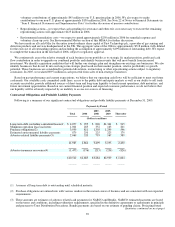
U.S. pension contributions of $630 million. The increase in cash provided by operating activities was partially offset by an increase in
asbestos liability payments, net of insurance receipts, of $558 million as the prior year included $472 million in cash received in
connection with a settlement with an insurance carrier, and an increase in working capital usage of $268 million principally related to
higher sales and a weakening of the U.S. dollar versus the Euro and Canadian dollar throughout 2004.
Cash used for investing activities increased by $1,426 million during 2005 compared with 2004 due primarily to an increase in
spending for acquisitions of $2,295 million (primarily Novar, UOP and Zellweger) partially offset by an increase in proceeds from
sales of businesses of $571 million largely from the sale of the Security Printing business and an increase in proceeds of $320 million
from maturities of investment securities. Cash used for investing activities decreased by $96 million during 2004 compared with 2003
due primarily to an increase in proceeds from sales of businesses of $289 million largely from the dispositions of our Security
Monitoring and VCSEL Optical Products businesses in 2004. Additionally, proceeds from the maturity of investment securities were
$80 million in 2004. The decrease in cash used for investing activities was partially offset by an increase in spending for acquisitions
of $185 million due principally to various acquisitions in our Automation and Control Solutions reportable segment and an investment
of $115 million in auction rate securities.
Cash used for financing activities increased by $1,493 million during 2005 compared with 2004 due primarily to an increase in
debt repayments of $1,120 million related to an increase in scheduled maturities of long-term debt of $953 million and a repayment of
debt of $702 million assumed in the Novar acquisition, partially offset by an increase in short-term and commercial paper borrowings
of $535 million related principally to the UOP acquisition and share repurchases. The increase in cash used for financing activities
was also driven by an increase in repurchases of common stock of $409 million and higher dividend payments of $57 million partially
offset by increased proceeds from issuances of common stock of $93 million. Total debt of $5,106 million at December 31, 2005 was
$167 million, or 3 percent lower than at December 31, 2004 mainly due to lower long-term debt due to scheduled maturities in 2005
partially offset by higher short-term borrowings mainly due to acquisitions and share repurchases. Cash used for financing activities
increased by $328 million during 2004 compared with 2003 due primarily to an increase in repurchases of common stock of $687
million in connection with our stock repurchase program partially offset by a reduction in debt repayments, net of issuances, of $337
million in 2004. Total debt of $5,273 million at December 31, 2004 was $113 million, or 2 percent higher than at December 31, 2003
principally reflecting higher commercial paper borrowings to fund our share repurchases in 2004.
Liquidity
We manage our businesses to maximize operating cash flows as the primary source of our liquidity. Operating cash flows were
$2.4 billion in 2005. We have approximately $1.2 billion in cash and cash equivalents at December 31, 2005 down from $3.6 billion at
December 31, 2004 due primarily to acquisitions and share repurchases. Working capital (receivables, inventories and accounts
payable) was $5.5 billion at December 31, 2005. Each of our businesses are focused on implementing strategies to improve working
capital turnover in 2006 to increase operating cash flows. Considering the current economic environment in which each of our
businesses operate and our business plans and strategies, including our focus on growth, cost reduction and productivity initiatives, we
believe that our cash balances and operating cash flows will remain our principal source of liquidity. In addition to our available cash
and operating cash flows, additional sources of liquidity include committed credit lines, access to the public debt and equity markets,
as well as our ability to sell trade accounts receivables.
A source of liquidity is our ability to issue short-term debt in the commercial paper market. Commercial paper notes are sold at a
discount and have a maturity of not more than 270 days from date of issuance. Borrowings under the commercial paper program are
available for general corporate purposes as well as for financing potential acquisitions. There was $754 million of commercial paper
outstanding at December 31, 2005.
Our ability to access the commercial paper market, and the related cost of these borrowings, is affected by the strength of our
credit ratings and our $2.5 billion of committed bank revolving credit facilities (Revolving Credit Facilities). Our credit ratings are
periodically reviewed by the major
37