Honeywell 2005 Annual Report Download - page 270
Download and view the complete annual report
Please find page 270 of the 2005 Honeywell annual report below. You can navigate through the pages in the report by either clicking on the pages listed below, or by using the keyword search tool below to find specific information within the annual report.-
 1
1 -
2
-
3
-
4
-
5
-
6
-
7
-
8
-
9
-
10
-
11
-
12
-
13
-
14
-
15
-
16
-
17
-
18
-
19
-
20
-
21
-
22
-
23
-
24
-
25
-
26
-
27
-
28
-
29
-
30
-
31
-
32
-
33
-
34
-
35
-
36
-
37
-
38
-
39
-
40
-
41
-
42
-
43
-
44
-
45
-
46
-
47
-
48
-
49
-
50
-
51
-
52
-
53
-
54
-
55
-
56
-
57
-
58
-
59
-
60
-
61
-
62
-
63
-
64
-
65
-
66
-
67
-
68
-
69
-
70
-
71
-
72
-
73
-
74
-
75
-
76
-
77
-
78
-
79
-
80
-
81
-
82
-
83
-
84
-
85
-
86
-
87
-
88
-
89
-
90
-
91
-
92
-
93
-
94
-
95
-
96
-
97
-
98
-
99
-
100
-
101
-
102
-
103
-
104
-
105
-
106
-
107
-
108
-
109
-
110
-
111
-
112
-
113
-
114
-
115
-
116
-
117
-
118
-
119
-
120
-
121
-
122
-
123
-
124
-
125
-
126
-
127
-
128
-
129
-
130
-
131
-
132
-
133
-
134
-
135
-
136
-
137
-
138
-
139
-
140
-
141
-
142
-
143
-
144
-
145
-
146
-
147
-
148
-
149
-
150
-
151
-
152
-
153
-
154
-
155
-
156
-
157
-
158
-
159
-
160
-
161
-
162
-
163
-
164
-
165
-
166
-
167
-
168
-
169
-
170
-
171
-
172
-
173
-
174
-
175
-
176
-
177
-
178
-
179
-
180
-
181
-
182
-
183
-
184
-
185
-
186
-
187
-
188
-
189
-
190
-
191
-
192
-
193
-
194
-
195
-
196
-
197
-
198
-
199
-
200
-
201
-
202
-
203
-
204
-
205
-
206
-
207
-
208
-
209
-
210
-
211
-
212
-
213
-
214
-
215
-
216
-
217
-
218
-
219
-
220
-
221
-
222
-
223
-
224
-
225
-
226
-
227
-
228
-
229
-
230
-
231
-
232
-
233
-
234
-
235
-
236
-
237
-
238
-
239
-
240
-
241
-
242
-
243
-
244
-
245
-
246
-
247
-
248
-
249
-
250
-
251
-
252
-
253
-
254
-
255
-
256
-
257
-
258
-
259
-
 260
260 -
 261
261 -
 262
262 -
 263
263 -
 264
264 -
 265
265 -
 266
266 -
 267
267 -
 268
268 -
 269
269 -
 270
270 -
 271
271 -
 272
272 -
 273
273 -
 274
274 -
 275
275 -
 276
276 -
 277
277 -
 278
278 -
 279
279 -
 280
280 -
281
-
282
-
283
-
284
-
285
-
286
 |
 |

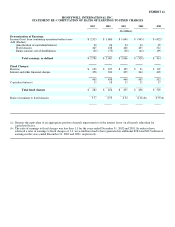
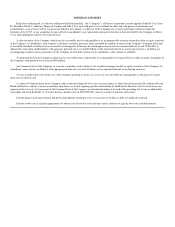
EXHIBIT 12
HONEYWELL INTERNATIONAL INC.
STATEMENT RE: COMPUTATION OF RATIO OF EARNINGS TO FIXED CHARGES
2005 2004 2003 2002 2001
(In millions)
Determination of Earnings:
Income (loss) from continuing operations before taxes $ 2,323 $ 1,680 $ 1,640 $ (945) $ (422)
Add (Deduct):
Amortization of capitalized interest 22 24 24 24 25
Fixed charges 465 438 440 435 512
Equity income, net of distributions (30) (75) (38) (42) 199
Total earnings, as defined $ 2,780 $ 2,067 $ 2,066 $ (528) $ 314
Fixed Charges:
Rents(a) $ 109 $ 107 $ 105 $ 91 $ 107
Interest and other financial charges 356 331 335 344 405
465 438 440 435 512
Capitalized interest 17 18 15 21 17
Total fixed charges $ 482 $ 456 $ 455 $ 456 $ 529
Ratio of earnings to fixed charges 5.77 4.53 4.54 (1.16)(b) 0.59(b)
(a) Denotes the equivalent of an appropriate portion of rentals representative of the interest factor on all rentals other than for
capitalized leases.
(b) The ratio of earnings to fixed charges was less than 1:1 for the years ended December 31, 2002 and 2001. In order to have
achieved a ratio of earnings to fixed charges of 1:1, we would have had to have generated an additional $984 and $215 million of
earnings in the years ended December 31, 2002 and 2001, respectively.