Honeywell 2005 Annual Report Download - page 116
Download and view the complete annual report
Please find page 116 of the 2005 Honeywell annual report below. You can navigate through the pages in the report by either clicking on the pages listed below, or by using the keyword search tool below to find specific information within the annual report.-
 1
1 -
2
-
3
-
4
-
5
-
6
-
7
-
8
-
9
-
10
-
11
-
12
-
13
-
14
-
15
-
16
-
17
-
18
-
19
-
20
-
21
-
22
-
23
-
24
-
25
-
26
-
27
-
28
-
29
-
30
-
31
-
32
-
33
-
34
-
35
-
36
-
37
-
38
-
39
-
40
-
41
-
42
-
43
-
44
-
45
-
46
-
47
-
48
-
49
-
50
-
51
-
52
-
53
-
54
-
55
-
56
-
57
-
58
-
59
-
60
-
61
-
62
-
63
-
64
-
65
-
66
-
67
-
68
-
69
-
70
-
71
-
72
-
73
-
74
-
75
-
76
-
77
-
78
-
79
-
80
-
81
-
82
-
83
-
84
-
85
-
86
-
87
-
88
-
89
-
90
-
91
-
92
-
93
-
94
-
95
-
96
-
97
-
98
-
99
-
100
-
101
-
102
-
103
-
104
-
105
-
 106
106 -
 107
107 -
 108
108 -
 109
109 -
 110
110 -
 111
111 -
 112
112 -
 113
113 -
 114
114 -
 115
115 -
 116
116 -
 117
117 -
 118
118 -
 119
119 -
 120
120 -
 121
121 -
 122
122 -
 123
123 -
 124
124 -
 125
125 -
 126
126 -
127
-
128
-
129
-
130
-
131
-
132
-
133
-
134
-
135
-
136
-
137
-
138
-
139
-
140
-
141
-
142
-
143
-
144
-
145
-
146
-
147
-
148
-
149
-
150
-
151
-
152
-
153
-
154
-
155
-
156
-
157
-
158
-
159
-
160
-
161
-
162
-
163
-
164
-
165
-
166
-
167
-
168
-
169
-
170
-
171
-
172
-
173
-
174
-
175
-
176
-
177
-
178
-
179
-
180
-
181
-
182
-
183
-
184
-
185
-
186
-
187
-
188
-
189
-
190
-
191
-
192
-
193
-
194
-
195
-
196
-
197
-
198
-
199
-
200
-
201
-
202
-
203
-
204
-
205
-
206
-
207
-
208
-
209
-
210
-
211
-
212
-
213
-
214
-
215
-
216
-
217
-
218
-
219
-
220
-
221
-
222
-
223
-
224
-
225
-
226
-
227
-
228
-
229
-
230
-
231
-
232
-
233
-
234
-
235
-
236
-
237
-
238
-
239
-
240
-
241
-
242
-
243
-
244
-
245
-
246
-
247
-
248
-
249
-
250
-
251
-
252
-
253
-
254
-
255
-
256
-
257
-
258
-
259
-
260
-
261
-
262
-
263
-
264
-
265
-
266
-
267
-
268
-
269
-
270
-
271
-
272
-
273
-
274
-
275
-
276
-
277
-
278
-
279
-
280
-
281
-
282
-
283
-
284
-
285
-
286
 |
 |

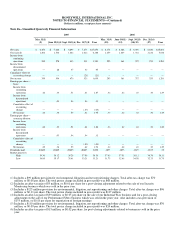
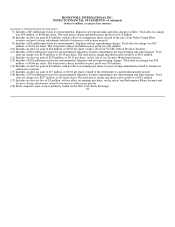
HONEYWELL INTERNATIONAL INC.
NOTES TO FINANCIAL STATEMENTS—(Continued)
(Dollars in millions, except per share amounts)
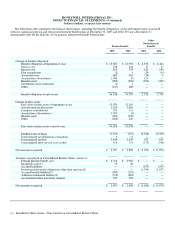
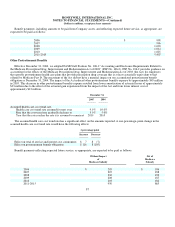
Benefit payments, including amounts to be paid from Company assets, and reflecting expected future service, as appropriate, are
expected to be paid as follows:
2006 $ 998
2007 996
2008 1,003
2009 1,014
2010 1,025
2011-2015 5,407
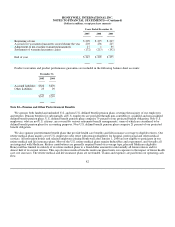
Other Postretirement Benefits
Effective December 31, 2004, we adopted FASB Staff Position No. 106-2 “Accounting and Disclosure Requirements Related to
the Medicare Prescription Drug, Improvement and Modernization Act of 2003” (FSP No. 106-2). FSP No. 106-2 provides guidance on
accounting for the effects of the Medicare Prescription Drug, Improvement and Modernization Act of 2003 (the Act) for employers
that sponsor postretirement health care plans that provide prescription drug coverage that is at least actuarially equivalent to that
offered by Medicare Part D. The enactment of the Act did not have a material impact on our accumulated postretirement benefit
obligation as December 31, 2004. The impact of the Act reduced other postretirement benefits expense by approximately $45 million
in 2005. This decrease in other postretirement benefits expense resulted from lower amortization of actuarial losses of approximately
$33 million due to the effect of the actuarial gain experienced from the impact of the Act and from lower interest cost of
approximately $12 million.
December 31,
2005 2004
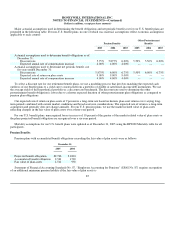
Assumed health care cost trend rate:
Health care cost trend rate assumed for next year 9.0% 10.0%
Rate that the cost trend rate gradually declines to 5.0% 5.0%
Year that the rate reaches the rate it is assumed to remain at 2010 2010
The assumed health care cost trend rate has a significant effect on the amounts reported. A one-percentage-point change in the
assumed health care cost trend rate would have the following effects:
1 percentage point
Increase Decrease
Effect on total of service and interest cost components $ 7 $ (7)
Effect on postretirement benefit obligation $ 116 $ (105)
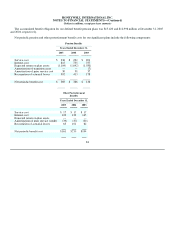
Benefit payments reflecting expected future service, as appropriate, are expected to be paid as follows:
Without Impact
of
Medicare Subsidy
Net of
Medicare
Subsidy
2006 $ 205 $ 186
2007 207 188
2008 210 190
2009 208 187
2010 203 182
2011-2015 950 865
87