Honeywell 2005 Annual Report Download - page 21
Download and view the complete annual report
Please find page 21 of the 2005 Honeywell annual report below. You can navigate through the pages in the report by either clicking on the pages listed below, or by using the keyword search tool below to find specific information within the annual report.-
 1
1 -
2
-
3
-
4
-
5
-
6
-
7
-
8
-
9
-
10
-
 11
11 -
 12
12 -
 13
13 -
 14
14 -
 15
15 -
 16
16 -
 17
17 -
 18
18 -
 19
19 -
 20
20 -
 21
21 -
 22
22 -
 23
23 -
 24
24 -
 25
25 -
 26
26 -
 27
27 -
 28
28 -
 29
29 -
 30
30 -
 31
31 -
32
-
33
-
34
-
35
-
36
-
37
-
38
-
39
-
40
-
41
-
42
-
43
-
44
-
45
-
46
-
47
-
48
-
49
-
50
-
51
-
52
-
53
-
54
-
55
-
56
-
57
-
58
-
59
-
60
-
61
-
62
-
63
-
64
-
65
-
66
-
67
-
68
-
69
-
70
-
71
-
72
-
73
-
74
-
75
-
76
-
77
-
78
-
79
-
80
-
81
-
82
-
83
-
84
-
85
-
86
-
87
-
88
-
89
-
90
-
91
-
92
-
93
-
94
-
95
-
96
-
97
-
98
-
99
-
100
-
101
-
102
-
103
-
104
-
105
-
106
-
107
-
108
-
109
-
110
-
111
-
112
-
113
-
114
-
115
-
116
-
117
-
118
-
119
-
120
-
121
-
122
-
123
-
124
-
125
-
126
-
127
-
128
-
129
-
130
-
131
-
132
-
133
-
134
-
135
-
136
-
137
-
138
-
139
-
140
-
141
-
142
-
143
-
144
-
145
-
146
-
147
-
148
-
149
-
150
-
151
-
152
-
153
-
154
-
155
-
156
-
157
-
158
-
159
-
160
-
161
-
162
-
163
-
164
-
165
-
166
-
167
-
168
-
169
-
170
-
171
-
172
-
173
-
174
-
175
-
176
-
177
-
178
-
179
-
180
-
181
-
182
-
183
-
184
-
185
-
186
-
187
-
188
-
189
-
190
-
191
-
192
-
193
-
194
-
195
-
196
-
197
-
198
-
199
-
200
-
201
-
202
-
203
-
204
-
205
-
206
-
207
-
208
-
209
-
210
-
211
-
212
-
213
-
214
-
215
-
216
-
217
-
218
-
219
-
220
-
221
-
222
-
223
-
224
-
225
-
226
-
227
-
228
-
229
-
230
-
231
-
232
-
233
-
234
-
235
-
236
-
237
-
238
-
239
-
240
-
241
-
242
-
243
-
244
-
245
-
246
-
247
-
248
-
249
-
250
-
251
-
252
-
253
-
254
-
255
-
256
-
257
-
258
-
259
-
260
-
261
-
262
-
263
-
264
-
265
-
266
-
267
-
268
-
269
-
270
-
271
-
272
-
273
-
274
-
275
-
276
-
277
-
278
-
279
-
280
-
281
-
282
-
283
-
284
-
285
-
286
 |
 |

“forward-looking statements” within the meaning of Section 21E of the Securities Exchange Act of 1934.
Forward-looking statements are those that address activities, events or developments that management intends, expects, projects,
believes or anticipates will or may occur in the future. They are based on management's assumptions and assessments in light of past
experience and trends, current conditions, expected future developments and other relevant factors. They are not guarantees of future
performance, and actual results, developments and business decisions may differ significantly from those envisaged by our forward-
looking statements. We do not undertake to update or revise any of our forward-looking statements. Our forward-looking statements
are also subject to risks and uncertainties that can affect our performance in both the near-and long-term. These forward-looking
statements should be considered in light of the information included in this Form 10-K, including, in particular, the factors discussed
below.
Risk Factors
Our business, operating results, cash flows and financial condition are subject to various risks and uncertainties, including, without
limitation, those set forth below, any one of which could cause our actual results to vary materially from recent results or from our
anticipated future results.
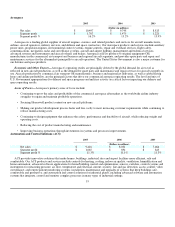
Industry and economic conditions may adversely affect the market and operating conditions of our customers, which in turn can
affect demand for our products and services and our results of operations.
The operating results of our segments are impacted by general industry and economic conditions that can cause changes in
spending and capital investment patterns, demand for our products and services and the level of our manufacturing costs. The
operating results of our Aerospace segment, which generated 38 percent of our consolidated revenues in 2005, are directly tied to
cyclical industry and economic conditions, including global demand for air travel as reflected in new aircraft production and/or the
retirement of older aircraft, global flying hours, and business and general aviation aircraft utilization rates, as well as the level and mix
of U.S. Government appropriations for defense and space programs (as further discussed below). The challenging operating
environment faced by the commercial airline industry is expected to continue and may be influenced by a wide variety of factors,
including aircraft fuel prices, labor issues, airline insolvencies, terrorism and safety concerns, and changes in regulations. Future
terrorist actions or pandemic health issues could dramatically reduce both the demand for air travel and our Aerospace aftermarket
sales and margins. The operating results of our Automation and Control Solutions (ACS) segment, which generated 34 percent of our
consolidated revenues in 2005, are impacted by the level of global residential and commercial construction (including retrofits and
upgrades), capital spending on building and process automation, industrial plant capacity utilization and expansion, and material price
inflation. Specialty Materials' operating results are impacted by global gross domestic product and capacity utilization for chemical,
industrial, refining and petrochemical plants. Transportation Systems' operating results are impacted by global production and demand
for automobiles and trucks equipped with turbochargers, and consumer spending for automotive aftermarket and car care products.
Because approximately 28 percent of our sales are in Europe, the relative strength of the European economy and exchange rate
fluctuations impact our sales and margins.
Raw material price fluctuations and the ability of key suppliers to meet quality and delivery requirements can increase the cost of
our products and services and impact our ability to meet commitments to customers.
The cost of raw materials is a key element in the cost of our products, particularly in our Specialty Materials (benzene and natural
gas) and Transportation Systems (steel and other metals) segments. Our inability to offset material price inflation with pricing or
productivity actions could adversely affect our results of operations.
Our manufacturing operations are also highly dependent upon the delivery of materials by outside suppliers and their assembly of
major components and subsystems used in our products in a timely manner and in full compliance with purchase order terms and
conditions, quality standards, and
10