Honeywell 2005 Annual Report Download - page 18
Download and view the complete annual report
Please find page 18 of the 2005 Honeywell annual report below. You can navigate through the pages in the report by either clicking on the pages listed below, or by using the keyword search tool below to find specific information within the annual report.
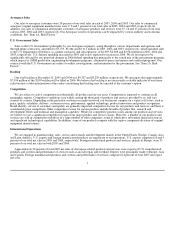
Aerospace Sales
Our sales to aerospace customers were 38 percent of our total sales in each of 2005, 2004 and 2003. Our sales to commercial
aerospace original equipment manufacturers were 9, 8 and 7 percent of our total sales in 2005, 2004 and 2003, respectively. In
addition, our sales to commercial aftermarket customers of aerospace products and services were 15, 16 and 15 percent of our total
sales in 2005, 2004 and 2003, respectively. Our Aerospace results of operations can be impacted by various industry and economic
conditions. See “Item 1A. Risk Factors.”
U.S. Government Sales
Sales to the U.S. Government (principally by our Aerospace segment), acting through its various departments and agencies and
through prime contractors, amounted to $3,719, $3,464 and $3,111 million in 2005, 2004 and 2003, respectively, which included sales
to the U.S. Department of Defense, as a prime contractor and subcontractor, of $2,939, $2,808 and $2,564 million in 2005, 2004 and
2003, respectively. U.S. defense spending increased in 2005 and is also expected to increase in 2006. We do not expect to be
significantly affected by any proposed changes in 2006 federal spending due principally to the varied mix of the government programs
which impact us (OEM production, engineering development programs, aftermarket spares and repairs and overhaul programs). Our
contracts with the U.S. Government are subject to audits, investigations, and termination by the government. See “Item 1A. Risk
Factors.”
Backlog
Our total backlog at December 31, 2005 and 2004 was $9,327 and $8,229 million, respectively. We anticipate that approximately
$7,594 million of the 2005 backlog will be filled in 2006. We believe that backlog is not necessarily a reliable indicator of our future
sales because a substantial portion of the orders constituting this backlog may be canceled at the customer's option.
Competition
We are subject to active competition in substantially all product and service areas. Competition is expected to continue in all
geographic regions. Competitive conditions vary widely among the thousands of products and services provided by us, and vary
country by country. Depending on the particular customer or market involved, our businesses compete on a variety of factors, such as
price, quality, reliability, delivery, customer service, performance, applied technology, product innovation and product recognition.
Brand identity, service to customers and quality are generally important competitive factors for our products and services, and there is
considerable price competition. Other competitive factors for certain products include breadth of product line, research and
development efforts and technical and managerial capability. While our competitive position varies among our products and services,
we believe we are a significant competitor in each of our major product and service classes. However, a number of our products and
services are sold in competition with those of a large number of other companies, some of which have substantial financial resources
and significant technological capabilities. In addition, some of our products compete with the captive component divisions of original
equipment manufacturers.
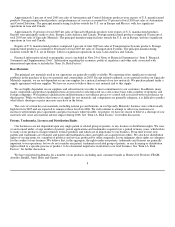
International Operations
We are engaged in manufacturing, sales, service and research and development mainly in the United States, Europe, Canada, Asia
and Latin America. U.S. exports and foreign manufactured products are significant to our operations. U.S. exports comprised 10 and 9
percent of our total net sales in 2005 and 2004, respectively. Foreign manufactured products and services, mainly in Europe, were 35
percent of our total net sales in both 2005 and 2004.
Approximately 20 percent of total 2005 net sales of Aerospace-related products and services were exports of U.S. manufactured
products and systems and performance of services such as aircraft repair and overhaul. Exports were principally made to Europe, Asia
and Canada. Foreign manufactured products and systems and performance of services comprised 14 percent of total 2005 Aerospace
net sales.
7


