Honeywell 2005 Annual Report Download - page 122
Download and view the complete annual report
Please find page 122 of the 2005 Honeywell annual report below. You can navigate through the pages in the report by either clicking on the pages listed below, or by using the keyword search tool below to find specific information within the annual report.-
 1
1 -
2
-
3
-
4
-
5
-
6
-
7
-
8
-
9
-
10
-
11
-
12
-
13
-
14
-
15
-
16
-
17
-
18
-
19
-
20
-
21
-
22
-
23
-
24
-
25
-
26
-
27
-
28
-
29
-
30
-
31
-
32
-
33
-
34
-
35
-
36
-
37
-
38
-
39
-
40
-
41
-
42
-
43
-
44
-
45
-
46
-
47
-
48
-
49
-
50
-
51
-
52
-
53
-
54
-
55
-
56
-
57
-
58
-
59
-
60
-
61
-
62
-
63
-
64
-
65
-
66
-
67
-
68
-
69
-
70
-
71
-
72
-
73
-
74
-
75
-
76
-
77
-
78
-
79
-
80
-
81
-
82
-
83
-
84
-
85
-
86
-
87
-
88
-
89
-
90
-
91
-
92
-
93
-
94
-
95
-
96
-
97
-
98
-
99
-
100
-
101
-
102
-
103
-
104
-
105
-
106
-
107
-
108
-
109
-
110
-
111
-
 112
112 -
 113
113 -
 114
114 -
 115
115 -
 116
116 -
 117
117 -
 118
118 -
 119
119 -
 120
120 -
 121
121 -
 122
122 -
 123
123 -
 124
124 -
 125
125 -
 126
126 -
 127
127 -
 128
128 -
 129
129 -
 130
130 -
 131
131 -
 132
132 -
133
-
134
-
135
-
136
-
137
-
138
-
139
-
140
-
141
-
142
-
143
-
144
-
145
-
146
-
147
-
148
-
149
-
150
-
151
-
152
-
153
-
154
-
155
-
156
-
157
-
158
-
159
-
160
-
161
-
162
-
163
-
164
-
165
-
166
-
167
-
168
-
169
-
170
-
171
-
172
-
173
-
174
-
175
-
176
-
177
-
178
-
179
-
180
-
181
-
182
-
183
-
184
-
185
-
186
-
187
-
188
-
189
-
190
-
191
-
192
-
193
-
194
-
195
-
196
-
197
-
198
-
199
-
200
-
201
-
202
-
203
-
204
-
205
-
206
-
207
-
208
-
209
-
210
-
211
-
212
-
213
-
214
-
215
-
216
-
217
-
218
-
219
-
220
-
221
-
222
-
223
-
224
-
225
-
226
-
227
-
228
-
229
-
230
-
231
-
232
-
233
-
234
-
235
-
236
-
237
-
238
-
239
-
240
-
241
-
242
-
243
-
244
-
245
-
246
-
247
-
248
-
249
-
250
-
251
-
252
-
253
-
254
-
255
-
256
-
257
-
258
-
259
-
260
-
261
-
262
-
263
-
264
-
265
-
266
-
267
-
268
-
269
-
270
-
271
-
272
-
273
-
274
-
275
-
276
-
277
-
278
-
279
-
280
-
281
-
282
-
283
-
284
-
285
-
286
 |
 |

HONEYWELL INTERNATIONAL INC.
NOTES TO FINANCIAL STATEMENTS—(Continued)
(Dollars in millions, except per share amounts)
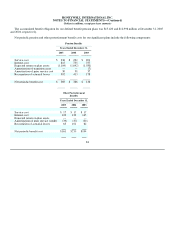
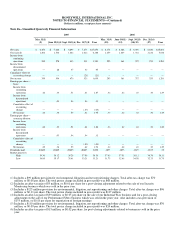
Note 26—Unaudited Quarterly Financial Information
2005 2004
Mar. 31(1)
(2) June 30(3)(4) Sept. 30(5)(6) Dec. 31(7)(8) Year Mar. 31(9)
(10) June 30(11)
(12) Sept. 30(13)
(14)(15) Dec. 31(16)
(17) Year
Net sales $ 6,453 $ 7,026 $ 6,899 $ 7,275 $27,653 $ 6,178 $ 6,388 $ 6,395 $ 6,640 $25,601
Gross profit 1,402 1,530 1,644 1,612 6,188 1,259 1,209 1,332 1,216 5,016
Income from
continuing
operations
359
278
433
511
1,581
295
361
372
253
1,281
Income from
discontinued
operations
—
28
37
30
95
—
—
—
—
—
Cumulative effect of
accounting change — — — (21) (21) — — — — —
Net income 359 306 470 520 1,655 295 361 372 253 1,281
Earnings per share—
basic:
Income from
continuing
operations
.42
.33
.51
.61
1.87
.34
.42
.43
.30
1.49
Income from
discontinued
operations
—
.03
.04
.04
.11
—
—
—
—
—
Cumulative effect of
accounting
change
—
—
—
(.03)
(.03)
—
—
—
—
—
Net income .42 .36 .55 .62 1.95 .34 .42 .43 .30 1.49
Earnings per share—
assuming dilution:
Income from
continuing
operations
.42
.33
.51
.61
1.86
.34
.42
.43
.30
1.49
Income from
discontinued
operations
—
.03
.04
.04
.11
—
—
—
—
—
Cumulative effect of
accounting
change
—
—
—
(.03)
(.03)
—
—
—
—
—
Net income .42 .36 .55 .62 1.94 .34 .42 .43 .30 1.49
Dividends paid .20625 .20625 .20625 .20625 .8250 .1875 .1875 .1875 .1875 .75
Market price(18)
High 39.30 38.12 39.29 37.96 39.30 37.43 37.51 38.11 36.76 38.11
Low 34.00 35.17 35.41 33.21 33.21 31.75 32.60 34.58 32.23 31.75
(1) Includes a $99 million provision for environmental, litigation and net repositioning charges. Total after-tax charge was $70
million, or $0.08 per share. The total pretax charge included in gross profit was $68 million.
(2) Includes an after-tax gain of $5 million, or $0.01 per share for a post-closing adjustment related to the sale of our Security
Monitoring business which was sold in the prior year.
(3) Includes a $123 million provision for environmental, litigation, net repositioning and other charges. Total after-tax charge was $96
million, or $0.11 per share. The total pretax charge included in gross profit was $117 million.
(4) Includes an after-tax gain of $39 million, or $0.05 per share on the sale of our Industrial Wax business and for a post-closing
adjustment on the sale of our Performance Fibers business which was sold in the prior year. Also includes a tax provision of
$155 million, or $0.18 per share for repatriation of foreign earnings.
(5) Includes a $110 million provision for environmental, litigation, net repositioning and other charges. Total after-tax charge was $76
million, or $0.09 per share. The total pretax charge included in gross profit was $24 million.
(6) Includes an after-tax gain of $13 million, or $0.02 per share, for post-closing adjustments related to businesses sold in the prior
year.