Honeywell 2005 Annual Report Download - page 86
Download and view the complete annual report
Please find page 86 of the 2005 Honeywell annual report below. You can navigate through the pages in the report by either clicking on the pages listed below, or by using the keyword search tool below to find specific information within the annual report.-
 1
1 -
2
-
3
-
4
-
5
-
6
-
7
-
8
-
9
-
10
-
11
-
12
-
13
-
14
-
15
-
16
-
17
-
18
-
19
-
20
-
21
-
22
-
23
-
24
-
25
-
26
-
27
-
28
-
29
-
30
-
31
-
32
-
33
-
34
-
35
-
36
-
37
-
38
-
39
-
40
-
41
-
42
-
43
-
44
-
45
-
46
-
47
-
48
-
49
-
50
-
51
-
52
-
53
-
54
-
55
-
56
-
57
-
58
-
59
-
60
-
61
-
62
-
63
-
64
-
65
-
66
-
67
-
68
-
69
-
70
-
71
-
72
-
73
-
74
-
75
-
 76
76 -
 77
77 -
 78
78 -
 79
79 -
 80
80 -
 81
81 -
 82
82 -
 83
83 -
 84
84 -
 85
85 -
 86
86 -
 87
87 -
 88
88 -
 89
89 -
 90
90 -
 91
91 -
 92
92 -
 93
93 -
 94
94 -
 95
95 -
 96
96 -
97
-
98
-
99
-
100
-
101
-
102
-
103
-
104
-
105
-
106
-
107
-
108
-
109
-
110
-
111
-
112
-
113
-
114
-
115
-
116
-
117
-
118
-
119
-
120
-
121
-
122
-
123
-
124
-
125
-
126
-
127
-
128
-
129
-
130
-
131
-
132
-
133
-
134
-
135
-
136
-
137
-
138
-
139
-
140
-
141
-
142
-
143
-
144
-
145
-
146
-
147
-
148
-
149
-
150
-
151
-
152
-
153
-
154
-
155
-
156
-
157
-
158
-
159
-
160
-
161
-
162
-
163
-
164
-
165
-
166
-
167
-
168
-
169
-
170
-
171
-
172
-
173
-
174
-
175
-
176
-
177
-
178
-
179
-
180
-
181
-
182
-
183
-
184
-
185
-
186
-
187
-
188
-
189
-
190
-
191
-
192
-
193
-
194
-
195
-
196
-
197
-
198
-
199
-
200
-
201
-
202
-
203
-
204
-
205
-
206
-
207
-
208
-
209
-
210
-
211
-
212
-
213
-
214
-
215
-
216
-
217
-
218
-
219
-
220
-
221
-
222
-
223
-
224
-
225
-
226
-
227
-
228
-
229
-
230
-
231
-
232
-
233
-
234
-
235
-
236
-
237
-
238
-
239
-
240
-
241
-
242
-
243
-
244
-
245
-
246
-
247
-
248
-
249
-
250
-
251
-
252
-
253
-
254
-
255
-
256
-
257
-
258
-
259
-
260
-
261
-
262
-
263
-
264
-
265
-
266
-
267
-
268
-
269
-
270
-
271
-
272
-
273
-
274
-
275
-
276
-
277
-
278
-
279
-
280
-
281
-
282
-
283
-
284
-
285
-
286
 |
 |

HONEYWELL INTERNATIONAL INC.
NOTES TO FINANCIAL STATEMENTS—(Continued)
(Dollars in millions, except per share amounts)
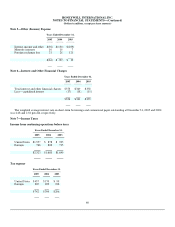
In 2005, 2004 and 2003, the diluted earnings per share calculation excludes the effect of stock options when the options' exercise
prices exceed the average market price of the common shares during the period. In 2005, 2004 and 2003, the number of stock options
not included in the computation were 17,793,385, 41,656,606 and 41,908,964, respectively. These stock options were outstanding at
the end of each of the respective years.
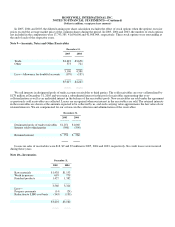
Note 9—Accounts, Notes and Other Receivables
December 31,
2005 2004
Trade $4,623 $3,656
Other 573 724
5,196 4,380
Less—Allowance for doubtful accounts (179) (137)
$5,017 $4,243
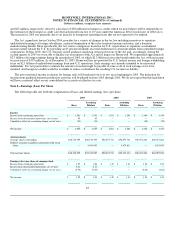
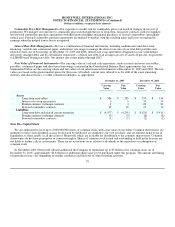
We sell interests in designated pools of trade accounts receivables to third parties. The sold receivables are over-collateralized by
$178 million at December 31, 2005 and we retain a subordinated interest in the pool of receivables representing that over-
collateralization as well as an undivided interest in the balance of the receivables pools. New receivables are sold under the agreement
as previously sold receivables are collected. Losses are recognized when our interest in the receivables are sold. The retained interests
in the receivables are shown at the amounts expected to be collected by us, and such carrying value approximates the fair value of our
retained interests. We are compensated for our services in the collection and administration of the receivables.
December 31,
2005 2004
Designated pools of trade receivables $1,251 $1,060
Interest sold to third parties (500) (500)
Retained interest $ 751 $ 560
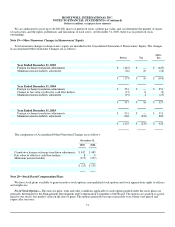
Losses on sales of receivables were $18, $9 and $7 million in 2005, 2004 and 2003, respectively. No credit losses were incurred
during those years.
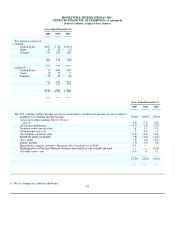
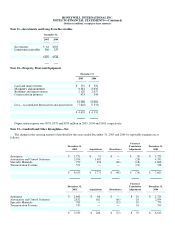
Note 10—Inventories
December 31,
2005 2004
Raw materials $1,438 $1,153
Work in process 695 779
Finished products 1,427 1,382
3,560 3,314
Less—
Progress payments (14) (24)
Reduction to LIFO cost basis (145) (130)
$3,401 $3,160