Honeywell 2005 Annual Report Download - page 29
Download and view the complete annual report
Please find page 29 of the 2005 Honeywell annual report below. You can navigate through the pages in the report by either clicking on the pages listed below, or by using the keyword search tool below to find specific information within the annual report.-
 1
1 -
2
-
3
-
4
-
5
-
6
-
7
-
8
-
9
-
10
-
11
-
12
-
13
-
14
-
15
-
16
-
17
-
18
-
 19
19 -
 20
20 -
 21
21 -
 22
22 -
 23
23 -
 24
24 -
 25
25 -
 26
26 -
 27
27 -
 28
28 -
 29
29 -
 30
30 -
 31
31 -
 32
32 -
 33
33 -
 34
34 -
 35
35 -
 36
36 -
 37
37 -
 38
38 -
 39
39 -
40
-
41
-
42
-
43
-
44
-
45
-
46
-
47
-
48
-
49
-
50
-
51
-
52
-
53
-
54
-
55
-
56
-
57
-
58
-
59
-
60
-
61
-
62
-
63
-
64
-
65
-
66
-
67
-
68
-
69
-
70
-
71
-
72
-
73
-
74
-
75
-
76
-
77
-
78
-
79
-
80
-
81
-
82
-
83
-
84
-
85
-
86
-
87
-
88
-
89
-
90
-
91
-
92
-
93
-
94
-
95
-
96
-
97
-
98
-
99
-
100
-
101
-
102
-
103
-
104
-
105
-
106
-
107
-
108
-
109
-
110
-
111
-
112
-
113
-
114
-
115
-
116
-
117
-
118
-
119
-
120
-
121
-
122
-
123
-
124
-
125
-
126
-
127
-
128
-
129
-
130
-
131
-
132
-
133
-
134
-
135
-
136
-
137
-
138
-
139
-
140
-
141
-
142
-
143
-
144
-
145
-
146
-
147
-
148
-
149
-
150
-
151
-
152
-
153
-
154
-
155
-
156
-
157
-
158
-
159
-
160
-
161
-
162
-
163
-
164
-
165
-
166
-
167
-
168
-
169
-
170
-
171
-
172
-
173
-
174
-
175
-
176
-
177
-
178
-
179
-
180
-
181
-
182
-
183
-
184
-
185
-
186
-
187
-
188
-
189
-
190
-
191
-
192
-
193
-
194
-
195
-
196
-
197
-
198
-
199
-
200
-
201
-
202
-
203
-
204
-
205
-
206
-
207
-
208
-
209
-
210
-
211
-
212
-
213
-
214
-
215
-
216
-
217
-
218
-
219
-
220
-
221
-
222
-
223
-
224
-
225
-
226
-
227
-
228
-
229
-
230
-
231
-
232
-
233
-
234
-
235
-
236
-
237
-
238
-
239
-
240
-
241
-
242
-
243
-
244
-
245
-
246
-
247
-
248
-
249
-
250
-
251
-
252
-
253
-
254
-
255
-
256
-
257
-
258
-
259
-
260
-
261
-
262
-
263
-
264
-
265
-
266
-
267
-
268
-
269
-
270
-
271
-
272
-
273
-
274
-
275
-
276
-
277
-
278
-
279
-
280
-
281
-
282
-
283
-
284
-
285
-
286
 |
 |

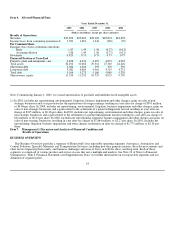
Item 6. Selected Financial Data
Years Ended December 31,
2005 2004 2003 2002 2001
(Dollars in millions, except per share amounts)
Results of Operations
Net sales $27,653 $25,601 $23,103 $22,274 $23,652
Income (loss) from continuing operations(1) 1,581 1,281 1,344 (220) (99)
Per Common Share
Earnings (loss) from continuing operations:
Basic 1.87 1.49 1.56 (0.27) (0.12)
Assuming dilution 1.86 1.49 1.56 (0.27) (0.12)
Dividends 0.825 0.75 0.75 0.75 0.75
Financial Position at Year-End
Property, plant and equipment—net 4,658 4,331 4,295 4,055 4,933
Total assets 32,294 31,062 29,314 27,565 24,226
Short-term debt 2,024 1,204 199 370 539
Long-term debt 3,082 4,069 4,961 4,719 4,731
Total debt 5,106 5,273 5,160 5,089 5,270
Shareowners' equity 11,254 11,252 10,729 8,925 9,170
Note: Commencing January 1, 2002, we ceased amortization of goodwill and indefinite-lived intangible assets.
(1)
In 2005, includes net repositioning, environmental, litigation, business impairment and other charges, gains on sales of non-
strategic businesses and a tax provision for the repatriation of foreign earnings resulting in a net after-tax charge of $391 million,
or $0.46 per share. In 2004, includes net repositioning, environmental, litigation, business impairment and other charges, gains on
sales of non-strategic businesses and a gain related to the settlement of a patent infringement lawsuit resulting in a net after-tax
charge of $315 million, or $0.36 per share. In 2003, includes net repositioning, environmental and other charges, gains on sales of
non-strategic businesses and a gain related to the settlement of a patent infringement lawsuit resulting in a net after-tax charge of
$22 million, or $0.03 per share. In 2002, includes net repositioning, litigation, business impairment and other charges and gains on
sales of non-strategic businesses resulting in a net after-tax charge of $1,864 million, or $2.27 per share. In 2001, includes net
repositioning, litigation, business impairment and other charges resulting in an after-tax charge of $1,771 million, or $2.18 per
share.
Item 7. Management's Discussion and Analysis of Financial Condition and
Results of Operations
BUSINESS OVERVIEW
This Business Overview provides a summary of Honeywell's four reportable operating segments (Aerospace, Automation and
Control Solutions, Specialty Materials and Transportation Systems), including how they generate income, the relevant economic and
other factors impacting their results, and business challenges and areas of focus in both the short- and long-term. Each of these
segments is comprised of various product and service classes that serve multiple end markets. See Note 23 of Notes to Financial
Statements in “Item 8. Financial Statements and Supplementary Data” for further information on our reportable segments and our
definition of segment profit.
18