Honeywell 2005 Annual Report Download - page 38
Download and view the complete annual report
Please find page 38 of the 2005 Honeywell annual report below. You can navigate through the pages in the report by either clicking on the pages listed below, or by using the keyword search tool below to find specific information within the annual report.-
 1
1 -
2
-
3
-
4
-
5
-
6
-
7
-
8
-
9
-
10
-
11
-
12
-
13
-
14
-
15
-
16
-
17
-
18
-
19
-
20
-
21
-
22
-
23
-
24
-
25
-
26
-
27
-
 28
28 -
 29
29 -
 30
30 -
 31
31 -
 32
32 -
 33
33 -
 34
34 -
 35
35 -
 36
36 -
 37
37 -
 38
38 -
 39
39 -
 40
40 -
 41
41 -
 42
42 -
 43
43 -
 44
44 -
 45
45 -
 46
46 -
 47
47 -
 48
48 -
49
-
50
-
51
-
52
-
53
-
54
-
55
-
56
-
57
-
58
-
59
-
60
-
61
-
62
-
63
-
64
-
65
-
66
-
67
-
68
-
69
-
70
-
71
-
72
-
73
-
74
-
75
-
76
-
77
-
78
-
79
-
80
-
81
-
82
-
83
-
84
-
85
-
86
-
87
-
88
-
89
-
90
-
91
-
92
-
93
-
94
-
95
-
96
-
97
-
98
-
99
-
100
-
101
-
102
-
103
-
104
-
105
-
106
-
107
-
108
-
109
-
110
-
111
-
112
-
113
-
114
-
115
-
116
-
117
-
118
-
119
-
120
-
121
-
122
-
123
-
124
-
125
-
126
-
127
-
128
-
129
-
130
-
131
-
132
-
133
-
134
-
135
-
136
-
137
-
138
-
139
-
140
-
141
-
142
-
143
-
144
-
145
-
146
-
147
-
148
-
149
-
150
-
151
-
152
-
153
-
154
-
155
-
156
-
157
-
158
-
159
-
160
-
161
-
162
-
163
-
164
-
165
-
166
-
167
-
168
-
169
-
170
-
171
-
172
-
173
-
174
-
175
-
176
-
177
-
178
-
179
-
180
-
181
-
182
-
183
-
184
-
185
-
186
-
187
-
188
-
189
-
190
-
191
-
192
-
193
-
194
-
195
-
196
-
197
-
198
-
199
-
200
-
201
-
202
-
203
-
204
-
205
-
206
-
207
-
208
-
209
-
210
-
211
-
212
-
213
-
214
-
215
-
216
-
217
-
218
-
219
-
220
-
221
-
222
-
223
-
224
-
225
-
226
-
227
-
228
-
229
-
230
-
231
-
232
-
233
-
234
-
235
-
236
-
237
-
238
-
239
-
240
-
241
-
242
-
243
-
244
-
245
-
246
-
247
-
248
-
249
-
250
-
251
-
252
-
253
-
254
-
255
-
256
-
257
-
258
-
259
-
260
-
261
-
262
-
263
-
264
-
265
-
266
-
267
-
268
-
269
-
270
-
271
-
272
-
273
-
274
-
275
-
276
-
277
-
278
-
279
-
280
-
281
-
282
-
283
-
284
-
285
-
286
 |
 |

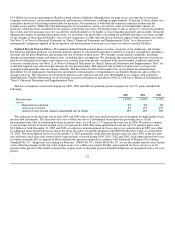
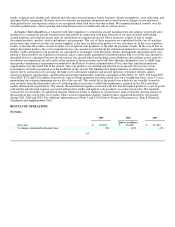
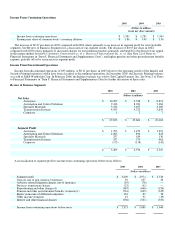
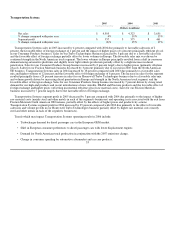
Pension expense decreased by $8 million in 2005 compared with 2004 due principally to a decrease in the amortization of
unrecognized net losses partially offset by pension expense for Novar, which was acquired in 2005. Pension expense increased by
$276 million in 2004 compared with 2003 due primarily to an increase in the amortization of unrecognized net losses resulting mainly
from actual plan asset returns below the expected rate of return during the period 2000 to 2002 and a decrease in the discount rate for
each year since 2001.
Other postretirement benefits expense decreased by $59 million in 2005 compared with 2004 due primarily to the effect of the
Medicare Prescription Drug, Improvement and Modernization Act of 2003. See Note 22 of Notes to Financial Statements in “Item 8.
Financial Statements and Supplementary Data” for further discussion.
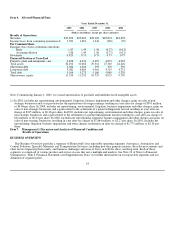
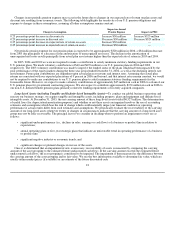
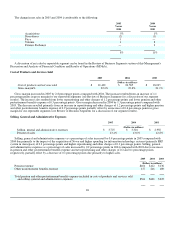
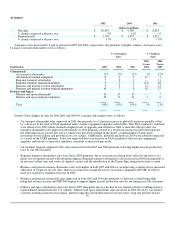
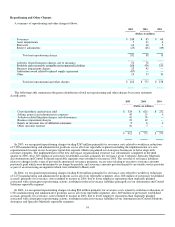
(Gain) Loss on Sale of Non-Strategic Businesses
2005 2004 2003
(Dollars in millions)
(Gain) loss on sale of non-strategic businesses $ (36) $ (255) $ (38)
Gain on sale of non-strategic businesses of $36 million in 2005 represents pretax gains totaling $66 million consisting of post-
closing adjustments of $43 million related principally to the sales of our Performance Fibers and Security Monitoring businesses in the
prior year and a pretax gain of $23 million related to the sale of our North American Nylon Carpet Fiber business, partially offset by a
pretax loss of $30 million related to the sale of our Industrial Wax business. The dispositions of these businesses did not materially
impact net sales and segment profit in 2005 compared with 2004. Gain on sale of non-strategic businesses of $255 million in 2004
represented the pretax gains on the sales of our Security Monitoring and VCSEL Optical Products businesses of $215 and $36 million,
respectively and post-closing adjustments of $19 million related to businesses sold in prior periods. The total pretax gain of $270
million was partially offset by the pretax loss of $15 million on the sale of our Performance Fibers business. The dispositions of these
businesses did not materially impact net sales and segment profit in 2004 compared with 2003.
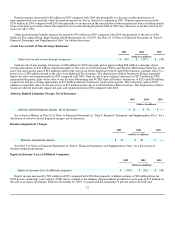
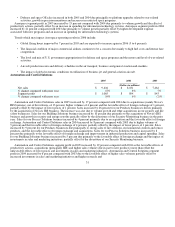
Asbestos Related Litigation Charges, Net of Insurance
2005 2004 2003
(Dollars in millions)
Asbestos related litigation charges, net of insurance $ 10 $ 76 $ —
See Asbestos Matters in Note 21 of Notes to Financial Statements in “Item 8. Financial Statements and Supplementary Data” for a
discussion of asbestos related litigation charges, net of insurance.
Business Impairment Charges
2005 2004 2003
(Dollars in millions)
Business impairment charges $ 23 $ 42 $ —
See Note 3 of Notes to Financial Statements in “Item 8. Financial Statements and Supplementary Data” for a discussion of
business impairment charges.
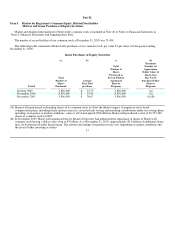
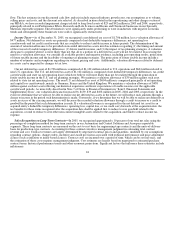
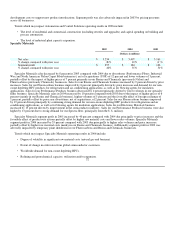
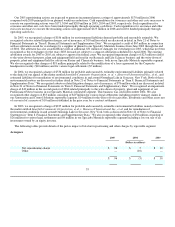
Equity in (Income) Loss of Affiliated Companies
2005 2004 2003
(Dollars in millions)
Equity in (income) loss of affiliated companies $ (134) $ (82) $ (38)
Equity income increased by $52 million in 2005 compared with 2004 due primarily to higher earnings of $36 million from our
UOP process technology joint venture (UOP) due to strength in the refining and petrochemical industries and a gain of $15 million on
the sale of an equity investment. Effective November 30, 2005, we purchased the remaining 50 percent interest in UOP and
27