Honeywell 2005 Annual Report Download - page 63
Download and view the complete annual report
Please find page 63 of the 2005 Honeywell annual report below. You can navigate through the pages in the report by either clicking on the pages listed below, or by using the keyword search tool below to find specific information within the annual report.-
 1
1 -
2
-
3
-
4
-
5
-
6
-
7
-
8
-
9
-
10
-
11
-
12
-
13
-
14
-
15
-
16
-
17
-
18
-
19
-
20
-
21
-
22
-
23
-
24
-
25
-
26
-
27
-
28
-
29
-
30
-
31
-
32
-
33
-
34
-
35
-
36
-
37
-
38
-
39
-
40
-
41
-
42
-
43
-
44
-
45
-
46
-
47
-
48
-
49
-
50
-
51
-
52
-
 53
53 -
 54
54 -
 55
55 -
 56
56 -
 57
57 -
 58
58 -
 59
59 -
 60
60 -
 61
61 -
 62
62 -
 63
63 -
 64
64 -
 65
65 -
 66
66 -
 67
67 -
 68
68 -
 69
69 -
 70
70 -
 71
71 -
 72
72 -
 73
73 -
74
-
75
-
76
-
77
-
78
-
79
-
80
-
81
-
82
-
83
-
84
-
85
-
86
-
87
-
88
-
89
-
90
-
91
-
92
-
93
-
94
-
95
-
96
-
97
-
98
-
99
-
100
-
101
-
102
-
103
-
104
-
105
-
106
-
107
-
108
-
109
-
110
-
111
-
112
-
113
-
114
-
115
-
116
-
117
-
118
-
119
-
120
-
121
-
122
-
123
-
124
-
125
-
126
-
127
-
128
-
129
-
130
-
131
-
132
-
133
-
134
-
135
-
136
-
137
-
138
-
139
-
140
-
141
-
142
-
143
-
144
-
145
-
146
-
147
-
148
-
149
-
150
-
151
-
152
-
153
-
154
-
155
-
156
-
157
-
158
-
159
-
160
-
161
-
162
-
163
-
164
-
165
-
166
-
167
-
168
-
169
-
170
-
171
-
172
-
173
-
174
-
175
-
176
-
177
-
178
-
179
-
180
-
181
-
182
-
183
-
184
-
185
-
186
-
187
-
188
-
189
-
190
-
191
-
192
-
193
-
194
-
195
-
196
-
197
-
198
-
199
-
200
-
201
-
202
-
203
-
204
-
205
-
206
-
207
-
208
-
209
-
210
-
211
-
212
-
213
-
214
-
215
-
216
-
217
-
218
-
219
-
220
-
221
-
222
-
223
-
224
-
225
-
226
-
227
-
228
-
229
-
230
-
231
-
232
-
233
-
234
-
235
-
236
-
237
-
238
-
239
-
240
-
241
-
242
-
243
-
244
-
245
-
246
-
247
-
248
-
249
-
250
-
251
-
252
-
253
-
254
-
255
-
256
-
257
-
258
-
259
-
260
-
261
-
262
-
263
-
264
-
265
-
266
-
267
-
268
-
269
-
270
-
271
-
272
-
273
-
274
-
275
-
276
-
277
-
278
-
279
-
280
-
281
-
282
-
283
-
284
-
285
-
286
 |
 |

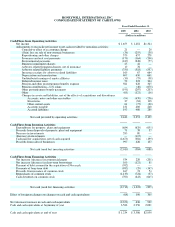
HONEYWELL INTERNATIONAL INC.
CONSOLIDATED STATEMENT OF CASH FLOWS
Years Ended December 31,
2005 2004 2003
(Dollars in millions)
Cash Flows from Operating Activities
Net income $ 1,655 $ 1,281 $1,324
Adjustments to reconcile net income to net cash provided by operating activities:
Cumulative effect of accounting change 21 — 20
(Gain) loss on sale of non-strategic businesses (36) (255) (38)
Repositioning and other charges 379 657 278
Severance and exit cost payments (171) (164) (200)
Environmental payments (247) (248) (77)
Business impairment charges 23 42 —
Asbestos related litigation charges, net of insurance 10 76 —
Asbestos related liability payments (750) (518) (557)
Insurance receipts for asbestos related liabilities 160 67 664
Depreciation and amortization 697 650 661
Undistributed earnings of equity affiliates (30) (75) (38)
Deferred income taxes 52 223 344
Pension and other postretirement benefits expense 561 628 325
Pension contributions—U.S. plans — (40) (670)
Other postretirement benefit payments (199) (207) (203)
Other (61) (121) (16)
Changes in assets and liabilities, net of the effects of acquisitions and divestitures:
Accounts, notes and other receivables (94) (470) (236)
Inventories 37 (84) 118
Other current assets 61 (77) (20)
Accounts payable 181 408 240
Accrued liabilities 193 480 280
Net cash provided by operating activities 2,442 2,253 2,199
Cash Flows from Investing Activities
Expenditures for property, plant and equipment (684) (629) (655)
Proceeds from disposals of property, plant and equipment 71 38 37
Decrease in investments 285 80 —
(Increase) in investments — (115) —
Cash paid for acquisitions, net of cash acquired (2,679) (384) (199)
Proceeds from sales of businesses 997 426 137
Net cash (used for) investing activities (2,010) (584) (680)
Cash Flows from Financing Activities
Net increase (decrease) in commercial paper 534 220 (201)
Net increase (decrease) in short-term borrowings 100 (121) 81
Payment of debt assumed in the acquisition of Novar plc (702) — —
Payments of long-term debt (982) (29) (147)
Proceeds from issuance of common stock 167 74 54
Repurchases of common stock (1,133) (724) (37)
Cash dividends on common stock (700) (643) (645)
Net cash (used for) financing activities (2,716) (1,223) (895)
Effect of foreign exchange rate changes on cash and cash equivalents (68) 190 305
Net (decrease) increase in cash and cash equivalents (2,352) 636 929
Cash and cash equivalents at beginning of year 3,586 2,950 2,021
Cash and cash equivalents at end of year $ 1,234 $ 3,586 $2,950