Honeywell 2005 Annual Report Download - page 33
Download and view the complete annual report
Please find page 33 of the 2005 Honeywell annual report below. You can navigate through the pages in the report by either clicking on the pages listed below, or by using the keyword search tool below to find specific information within the annual report.-
 1
1 -
2
-
3
-
4
-
5
-
6
-
7
-
8
-
9
-
10
-
11
-
12
-
13
-
14
-
15
-
16
-
17
-
18
-
19
-
20
-
21
-
22
-
 23
23 -
 24
24 -
 25
25 -
 26
26 -
 27
27 -
 28
28 -
 29
29 -
 30
30 -
 31
31 -
 32
32 -
 33
33 -
 34
34 -
 35
35 -
 36
36 -
 37
37 -
 38
38 -
 39
39 -
 40
40 -
 41
41 -
 42
42 -
 43
43 -
44
-
45
-
46
-
47
-
48
-
49
-
50
-
51
-
52
-
53
-
54
-
55
-
56
-
57
-
58
-
59
-
60
-
61
-
62
-
63
-
64
-
65
-
66
-
67
-
68
-
69
-
70
-
71
-
72
-
73
-
74
-
75
-
76
-
77
-
78
-
79
-
80
-
81
-
82
-
83
-
84
-
85
-
86
-
87
-
88
-
89
-
90
-
91
-
92
-
93
-
94
-
95
-
96
-
97
-
98
-
99
-
100
-
101
-
102
-
103
-
104
-
105
-
106
-
107
-
108
-
109
-
110
-
111
-
112
-
113
-
114
-
115
-
116
-
117
-
118
-
119
-
120
-
121
-
122
-
123
-
124
-
125
-
126
-
127
-
128
-
129
-
130
-
131
-
132
-
133
-
134
-
135
-
136
-
137
-
138
-
139
-
140
-
141
-
142
-
143
-
144
-
145
-
146
-
147
-
148
-
149
-
150
-
151
-
152
-
153
-
154
-
155
-
156
-
157
-
158
-
159
-
160
-
161
-
162
-
163
-
164
-
165
-
166
-
167
-
168
-
169
-
170
-
171
-
172
-
173
-
174
-
175
-
176
-
177
-
178
-
179
-
180
-
181
-
182
-
183
-
184
-
185
-
186
-
187
-
188
-
189
-
190
-
191
-
192
-
193
-
194
-
195
-
196
-
197
-
198
-
199
-
200
-
201
-
202
-
203
-
204
-
205
-
206
-
207
-
208
-
209
-
210
-
211
-
212
-
213
-
214
-
215
-
216
-
217
-
218
-
219
-
220
-
221
-
222
-
223
-
224
-
225
-
226
-
227
-
228
-
229
-
230
-
231
-
232
-
233
-
234
-
235
-
236
-
237
-
238
-
239
-
240
-
241
-
242
-
243
-
244
-
245
-
246
-
247
-
248
-
249
-
250
-
251
-
252
-
253
-
254
-
255
-
256
-
257
-
258
-
259
-
260
-
261
-
262
-
263
-
264
-
265
-
266
-
267
-
268
-
269
-
270
-
271
-
272
-
273
-
274
-
275
-
276
-
277
-
278
-
279
-
280
-
281
-
282
-
283
-
284
-
285
-
286
 |
 |

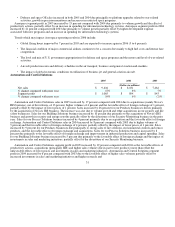
$1.9 billion in coverage remaining for Bendix related asbestos liabilities although there are gaps in our coverage due to insurance
company insolvencies, certain uninsured periods and insurance settlements, resulting in approximately 50 percent of these claims on a
cumulative historical basis being reimbursable by insurance. Our insurance is with both the domestic insurance market and the
London excess market. While the substantial majority of our insurance carriers are solvent, some of our individual carriers are
insolvent, which has been considered in our analysis of probable recoveries. Projecting future events is subject to various uncertainties
that could cause the insurance recovery on asbestos related liabilities to be higher or lower than that projected and recorded. Given the
inherent uncertainty in making future projections, we reevaluate our projections concerning our probable insurance recoveries in light
of any changes to the projected liability, our recovery experience or other relevant factors that may impact future insurance recoveries.
See Note 21 of Notes to Financial Statements in “Item 8. Financial Statements and Supplementary Data” for a discussion of
management's judgments applied in the recognition and measurement of insurance recoveries for asbestos related liabilities.
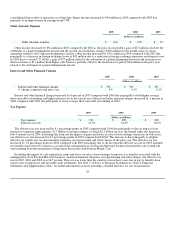
Defined Benefit Pension Plans—We maintain defined benefit pension plans covering a majority of our employees and retirees.
For financial reporting purposes, net periodic pension expense is calculated based upon a number of actuarial assumptions including a
discount rate for plan obligations and an expected rate of return on plan assets. We consider current market conditions, including
changes in investment returns and interest rates, in making these assumptions. We determine the expected long-term rate of return on
plan assets utilizing historic plan asset returns over varying long-term periods combined with current market conditions and broad
asset mix considerations (see Note 22 of Notes to Financial Statements in “Item 8. Financial Statements and Supplementary Data” for
actual and targeted asset allocation percentages for our pension plans). The expected rate of return on plan assets is a long-term
assumption and generally does not change annually. The discount rate reflects the market rate on our annual measurement date
(December 31) for high-quality fixed-income investments with maturities corresponding to our benefit obligations and is subject to
change each year. The expected rate of return on pension assets and discount rate were determined in accordance with consistent
methodologies. Further information on all our major actuarial assumption is included in Note 22 of Notes to Financial Statements in
“Item 8. Financial Statements and Supplementary Data”.
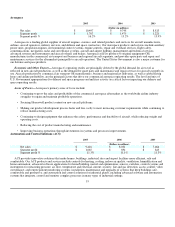
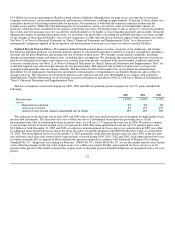
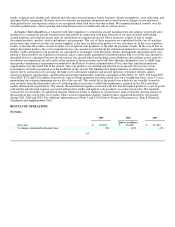
The key assumptions used in developing our 2005, 2004 and 2003 net periodic pension expense for our U.S. plans included the
following:
2005 2004 2003
Discount rate 5.875% 6.00% 6.75%
Assets:
Expected rate of return 9% 9% 9%
Actual rate of return 8% 13% 23%
Actual 10 year average annual compounded rate of return 10% 11% 10%
The reduction in the discount rate in both 2005 and 2004 reflects the lower market interest rate environment for high-quality fixed
income debt instruments. The discount rate is also volatile because it is determined based upon the prevailing rate as of the
measurement date. Due to continuing declines in interest rates, we will use a 5.75 percent discount rate in 2006. We plan to continue
to use an expected rate of return on plan assets of 9 percent for 2006. The unrecognized net losses for our U.S. pension plans were
$2.6 billion at both December 31, 2005 and 2004 as a decrease in unrecognized net losses due to loss amortization in 2005 was offset
by additional unrecognized net losses due to the lower discount rate and the adoption of the RP2000 Mortality Table as of December
31, 2005. The unrecognized net losses at December 31, 2005 principally result from the decline each year since 2001 in the discount
rate and from actual plan asset returns below expected rates of return during 2000, 2001, 2002 and 2005. Such unrecognized net losses
are being systematically recognized in future net periodic pension expense in accordance with Statement of Financial Accounting
Standards No. 87, “Employers Accounting for Pensions” (SFAS No. 87). Under SFAS No. 87, we use the market-related value of plan
assets reflecting changes in the fair value of plan assets over a three-year period. Further, unrecognized net losses in excess of 10
percent of the greater of the market-related value of plan assets or the plans projected benefit obligation are recognized over a six-year
period.
22