Honeywell 2005 Annual Report Download - page 120
Download and view the complete annual report
Please find page 120 of the 2005 Honeywell annual report below. You can navigate through the pages in the report by either clicking on the pages listed below, or by using the keyword search tool below to find specific information within the annual report.-
 1
1 -
2
-
3
-
4
-
5
-
6
-
7
-
8
-
9
-
10
-
11
-
12
-
13
-
14
-
15
-
16
-
17
-
18
-
19
-
20
-
21
-
22
-
23
-
24
-
25
-
26
-
27
-
28
-
29
-
30
-
31
-
32
-
33
-
34
-
35
-
36
-
37
-
38
-
39
-
40
-
41
-
42
-
43
-
44
-
45
-
46
-
47
-
48
-
49
-
50
-
51
-
52
-
53
-
54
-
55
-
56
-
57
-
58
-
59
-
60
-
61
-
62
-
63
-
64
-
65
-
66
-
67
-
68
-
69
-
70
-
71
-
72
-
73
-
74
-
75
-
76
-
77
-
78
-
79
-
80
-
81
-
82
-
83
-
84
-
85
-
86
-
87
-
88
-
89
-
90
-
91
-
92
-
93
-
94
-
95
-
96
-
97
-
98
-
99
-
100
-
101
-
102
-
103
-
104
-
105
-
106
-
107
-
108
-
109
-
 110
110 -
 111
111 -
 112
112 -
 113
113 -
 114
114 -
 115
115 -
 116
116 -
 117
117 -
 118
118 -
 119
119 -
 120
120 -
 121
121 -
 122
122 -
 123
123 -
 124
124 -
 125
125 -
 126
126 -
 127
127 -
 128
128 -
 129
129 -
 130
130 -
131
-
132
-
133
-
134
-
135
-
136
-
137
-
138
-
139
-
140
-
141
-
142
-
143
-
144
-
145
-
146
-
147
-
148
-
149
-
150
-
151
-
152
-
153
-
154
-
155
-
156
-
157
-
158
-
159
-
160
-
161
-
162
-
163
-
164
-
165
-
166
-
167
-
168
-
169
-
170
-
171
-
172
-
173
-
174
-
175
-
176
-
177
-
178
-
179
-
180
-
181
-
182
-
183
-
184
-
185
-
186
-
187
-
188
-
189
-
190
-
191
-
192
-
193
-
194
-
195
-
196
-
197
-
198
-
199
-
200
-
201
-
202
-
203
-
204
-
205
-
206
-
207
-
208
-
209
-
210
-
211
-
212
-
213
-
214
-
215
-
216
-
217
-
218
-
219
-
220
-
221
-
222
-
223
-
224
-
225
-
226
-
227
-
228
-
229
-
230
-
231
-
232
-
233
-
234
-
235
-
236
-
237
-
238
-
239
-
240
-
241
-
242
-
243
-
244
-
245
-
246
-
247
-
248
-
249
-
250
-
251
-
252
-
253
-
254
-
255
-
256
-
257
-
258
-
259
-
260
-
261
-
262
-
263
-
264
-
265
-
266
-
267
-
268
-
269
-
270
-
271
-
272
-
273
-
274
-
275
-
276
-
277
-
278
-
279
-
280
-
281
-
282
-
283
-
284
-
285
-
286
 |
 |

HONEYWELL INTERNATIONAL INC.
NOTES TO FINANCIAL STATEMENTS—(Continued)
(Dollars in millions, except per share amounts)
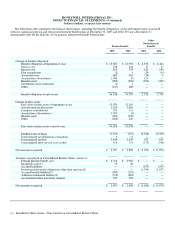
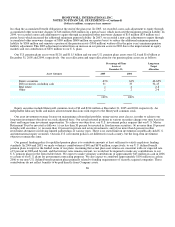
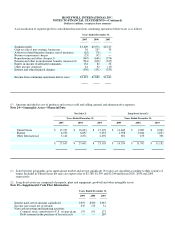
A reconciliation of segment profit to consolidated income from continuing operations before taxes is as follows:
Years Ended December 31,
2005 2004 2003
Segment profit $3,409 $2,974 $2,519
Gain on sale of non-strategic businesses 36 255 38
Asbestos related litigation charges, net of insurance (10) (76) —
Business impairment charges (23) (42) —
Repositioning and other charges(1) (367) (646) (276)
Pension and other postretirement benefits (expense)(1) (561) (628) (325)
Equity in income of affiliated companies 134 82 38
Other income (expense) 61 92 (19)
Interest and other financial charges (356) (331) (335)
Income from continuing operations before taxes $2,323 $1,680 $1,640
(1) Amounts included in cost of products and services sold and selling, general and administrative expenses.
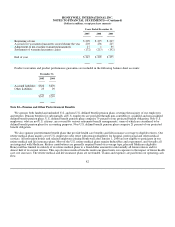
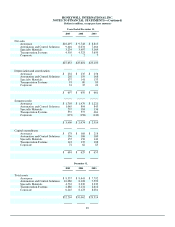
Note 24—Geographic Areas—Financial Data
Net Sales(1) Long-lived Assets(2)
Years Ended December 31, Years Ended December 31,
2005 2004 2003 2005 2004 2003
United States $ 17,957 $ 16,633 $ 15,178 $ 11,645 $ 9,083 $ 8,963
Europe 6,552 6,097 5,433 1,958 2,044 1,833
Other International 3,144 2,871 2,492 691 458 386
$ 27,653 $ 25,601 $ 23,103 $ 14,294 $ 11,585 $ 11,182
(1)
Sales between geographic areas approximate market and are not significant. Net sales are classified according to their country of
origin. Included in United States net sales are export sales of $2,780, $2,399 and $2,246 million in 2005, 2004 and 2003,
respectively.
(2) Long-lived assets are comprised of property, plant and equipment, goodwill and other intangible assets.
Note 25—Supplemental Cash Flow Information
Years Ended December 31,
2005 2004 2003
Interest paid, net of amounts capitalized $397 $330 $367
Income taxes paid, net of refunds 235 178 31
Non-cash investing and financing activities:
Common stock contributed to U.S. savings plans 153 151 173
Debt assumed in the purchase of leased assets — — 267