Honeywell 2005 Annual Report Download - page 44
Download and view the complete annual report
Please find page 44 of the 2005 Honeywell annual report below. You can navigate through the pages in the report by either clicking on the pages listed below, or by using the keyword search tool below to find specific information within the annual report.-
 1
1 -
2
-
3
-
4
-
5
-
6
-
7
-
8
-
9
-
10
-
11
-
12
-
13
-
14
-
15
-
16
-
17
-
18
-
19
-
20
-
21
-
22
-
23
-
24
-
25
-
26
-
27
-
28
-
29
-
30
-
31
-
32
-
33
-
 34
34 -
 35
35 -
 36
36 -
 37
37 -
 38
38 -
 39
39 -
 40
40 -
 41
41 -
 42
42 -
 43
43 -
 44
44 -
 45
45 -
 46
46 -
 47
47 -
 48
48 -
 49
49 -
 50
50 -
 51
51 -
 52
52 -
 53
53 -
 54
54 -
55
-
56
-
57
-
58
-
59
-
60
-
61
-
62
-
63
-
64
-
65
-
66
-
67
-
68
-
69
-
70
-
71
-
72
-
73
-
74
-
75
-
76
-
77
-
78
-
79
-
80
-
81
-
82
-
83
-
84
-
85
-
86
-
87
-
88
-
89
-
90
-
91
-
92
-
93
-
94
-
95
-
96
-
97
-
98
-
99
-
100
-
101
-
102
-
103
-
104
-
105
-
106
-
107
-
108
-
109
-
110
-
111
-
112
-
113
-
114
-
115
-
116
-
117
-
118
-
119
-
120
-
121
-
122
-
123
-
124
-
125
-
126
-
127
-
128
-
129
-
130
-
131
-
132
-
133
-
134
-
135
-
136
-
137
-
138
-
139
-
140
-
141
-
142
-
143
-
144
-
145
-
146
-
147
-
148
-
149
-
150
-
151
-
152
-
153
-
154
-
155
-
156
-
157
-
158
-
159
-
160
-
161
-
162
-
163
-
164
-
165
-
166
-
167
-
168
-
169
-
170
-
171
-
172
-
173
-
174
-
175
-
176
-
177
-
178
-
179
-
180
-
181
-
182
-
183
-
184
-
185
-
186
-
187
-
188
-
189
-
190
-
191
-
192
-
193
-
194
-
195
-
196
-
197
-
198
-
199
-
200
-
201
-
202
-
203
-
204
-
205
-
206
-
207
-
208
-
209
-
210
-
211
-
212
-
213
-
214
-
215
-
216
-
217
-
218
-
219
-
220
-
221
-
222
-
223
-
224
-
225
-
226
-
227
-
228
-
229
-
230
-
231
-
232
-
233
-
234
-
235
-
236
-
237
-
238
-
239
-
240
-
241
-
242
-
243
-
244
-
245
-
246
-
247
-
248
-
249
-
250
-
251
-
252
-
253
-
254
-
255
-
256
-
257
-
258
-
259
-
260
-
261
-
262
-
263
-
264
-
265
-
266
-
267
-
268
-
269
-
270
-
271
-
272
-
273
-
274
-
275
-
276
-
277
-
278
-
279
-
280
-
281
-
282
-
283
-
284
-
285
-
286
 |
 |

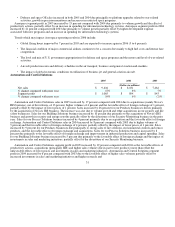
development costs to support new product introductions. Segment profit was also adversely impacted in 2003 by pricing pressures
across all businesses.
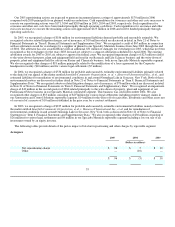
Trends which may impact Automation and Control Solutions operating results in 2006 include:
• The level of residential and commercial construction (including retrofits and upgrades) and capital spending on building and
process automation.
• The level of industrial plant capacity expansion.
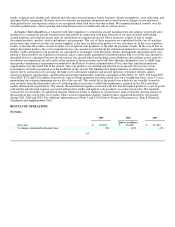
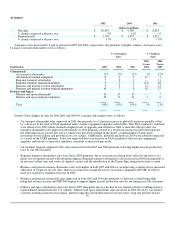
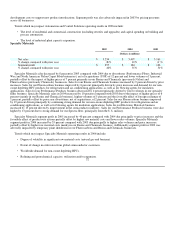
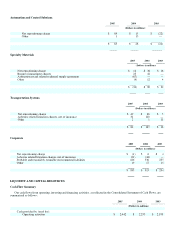
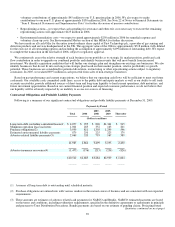
Specialty Materials
2005 2004 2003
(Dollars in millions)
Net sales $ 3,234 $ 3,497 $ 3,169
% change compared with prior year (8)% 10% (1)%
Segment profit $ 257 $ 184 $ 136
% change compared with prior year 40% 35% 51%
Specialty Materials sales decreased by 8 percent in 2005 compared with 2004 due to divestitures (Performance Fibers, Industrial
Wax and North American Nylon Carpet Fiber businesses), net of acquisitions (UOP) of 12 percent and lower volumes of 3 percent,
partially offset by the impact of higher prices of 7 percent primarily in our Resins and Chemicals (previously Nylon) and
Fluorocarbons (previously Chemicals) businesses. Sales for our Resins and Chemicals business increased by 9 percent driven by price
increases. Sales for our Fluorocarbons business improved by 6 percent principally driven by price increases and demand for our non-
ozone depleting HFC products for refrigeration and air conditioning applications, as well as for blowing agents for insulation
applications. Sales for our Performance Products business decreased by 4 percent primarily driven by lower volumes in our specialty
films business. Specialty Materials sales in 2004 increased by 10 percent compared with 2003 due to the impact of higher prices of 6
percent (mainly in our Resins and Chemicals business), higher volumes of 5 percent and the favorable effect of foreign exchange of
1 percent, partially offset by prior year divestitures, net of acquisitions, of 2 percent. Sales for our Fluorocarbons business improved
by 19 percent driven principally by continuing strong demand for our non-ozone depleting HFC products for refrigeration and air
conditioning applications, as well as for blowing agents for insulation applications. Sales for our Electronic Materials business
increased by 13 percent driven by improvement in the semiconductor industry. Sales for our Performance Products business were also
higher by 13 percent due to strong demand for our Spectra fiber, principally from the U.S. military.
Specialty Materials segment profit in 2005 increased by 40 percent compared with 2004 due principally to price increases and the
favorable effect of productivity actions partially offset by higher raw material costs and lower sales volumes. Specialty Materials
segment profit in 2004 increased by 35 percent compared with 2003 due principally to higher sales volumes and price increases,
partially offset by higher raw material costs mainly in our Resins and Chemicals business. Additionally segment profit in 2003 was
adversely impacted by temporary plant shutdowns in our Fluorocarbons and Resins and Chemicals businesses.
Trends which may impact Specialty Materials operating results in 2006 include:
• Degree of volatility in significant raw material costs (natural gas and benzene).
• Extent of change in order rates from global semiconductor customers.
• Worldwide demand for non-ozone depleting HFCs.
• Refining and petrochemical capacity, utilization and/or expansion.
32