Honeywell 2005 Annual Report Download - page 35
Download and view the complete annual report
Please find page 35 of the 2005 Honeywell annual report below. You can navigate through the pages in the report by either clicking on the pages listed below, or by using the keyword search tool below to find specific information within the annual report.-
 1
1 -
2
-
3
-
4
-
5
-
6
-
7
-
8
-
9
-
10
-
11
-
12
-
13
-
14
-
15
-
16
-
17
-
18
-
19
-
20
-
21
-
22
-
23
-
24
-
 25
25 -
 26
26 -
 27
27 -
 28
28 -
 29
29 -
 30
30 -
 31
31 -
 32
32 -
 33
33 -
 34
34 -
 35
35 -
 36
36 -
 37
37 -
 38
38 -
 39
39 -
 40
40 -
 41
41 -
 42
42 -
 43
43 -
 44
44 -
 45
45 -
46
-
47
-
48
-
49
-
50
-
51
-
52
-
53
-
54
-
55
-
56
-
57
-
58
-
59
-
60
-
61
-
62
-
63
-
64
-
65
-
66
-
67
-
68
-
69
-
70
-
71
-
72
-
73
-
74
-
75
-
76
-
77
-
78
-
79
-
80
-
81
-
82
-
83
-
84
-
85
-
86
-
87
-
88
-
89
-
90
-
91
-
92
-
93
-
94
-
95
-
96
-
97
-
98
-
99
-
100
-
101
-
102
-
103
-
104
-
105
-
106
-
107
-
108
-
109
-
110
-
111
-
112
-
113
-
114
-
115
-
116
-
117
-
118
-
119
-
120
-
121
-
122
-
123
-
124
-
125
-
126
-
127
-
128
-
129
-
130
-
131
-
132
-
133
-
134
-
135
-
136
-
137
-
138
-
139
-
140
-
141
-
142
-
143
-
144
-
145
-
146
-
147
-
148
-
149
-
150
-
151
-
152
-
153
-
154
-
155
-
156
-
157
-
158
-
159
-
160
-
161
-
162
-
163
-
164
-
165
-
166
-
167
-
168
-
169
-
170
-
171
-
172
-
173
-
174
-
175
-
176
-
177
-
178
-
179
-
180
-
181
-
182
-
183
-
184
-
185
-
186
-
187
-
188
-
189
-
190
-
191
-
192
-
193
-
194
-
195
-
196
-
197
-
198
-
199
-
200
-
201
-
202
-
203
-
204
-
205
-
206
-
207
-
208
-
209
-
210
-
211
-
212
-
213
-
214
-
215
-
216
-
217
-
218
-
219
-
220
-
221
-
222
-
223
-
224
-
225
-
226
-
227
-
228
-
229
-
230
-
231
-
232
-
233
-
234
-
235
-
236
-
237
-
238
-
239
-
240
-
241
-
242
-
243
-
244
-
245
-
246
-
247
-
248
-
249
-
250
-
251
-
252
-
253
-
254
-
255
-
256
-
257
-
258
-
259
-
260
-
261
-
262
-
263
-
264
-
265
-
266
-
267
-
268
-
269
-
270
-
271
-
272
-
273
-
274
-
275
-
276
-
277
-
278
-
279
-
280
-
281
-
282
-
283
-
284
-
285
-
286
 |
 |

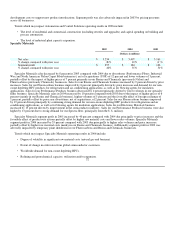
flow. The key estimates in our discounted cash flow analysis include expected industry growth rates, our assumptions as to volume,
selling prices and costs, and the discount rate selected. As described in more detail in the repositioning and other charges section of
our MD&A, we have recorded impairment charges related to long-lived assets of $23 and $42 million in 2005 and 2004, respectively,
principally related to our Performance Fibers, Research and Life Sciences and Resins and Chemicals businesses in our Specialty
Materials reportable segment. These businesses were significantly under-performing or were in industries with negative economic
trends and subsequently these businesses were sold or significantly restructured.
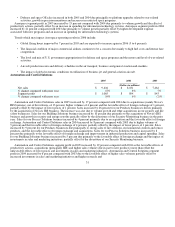
Income Taxes—As of December 31, 2005, we recognized a net deferred tax asset of $1,706 million, less a valuation allowance of
$477 million. Net deferred tax assets are primarily comprised of net deductible temporary differences, net operating loss
carryforwards and tax credit carryforwards that are available to reduce taxable income in future periods. The determination of the
amount of valuation allowance to be provided on recorded deferred tax assets involves estimates regarding (1) the timing and amount
of the reversal of taxable temporary differences, (2) future taxable income, and (3) the impact of tax planning strategies. A valuation
allowance is required when it is more likely than not that all or a portion of a deferred tax asset will not be realized. In assessing the
need for a valuation allowance, we consider all available positive and negative evidence, including past operating results, projections
of future taxable income and the feasibility of ongoing tax planning strategies. The projections of future taxable income include a
number of estimates and assumptions regarding our volume, pricing and costs. Additionally, valuation allowances related to deferred
tax assets can be impacted by changes to tax laws.
Our net deferred tax asset of $1,706 million is comprised of $1,102 million related to U.S. operations and $604 million related to
non-U.S. operations. The U.S. net deferred tax asset of $1,102 million is comprised of net deductible temporary differences, tax credit
carryforwards and state tax net operating losses which we believe will more likely than not be realized through the generation of
future taxable income in the U.S. and tax planning strategies. We maintain a valuation allowance of $39 million against such asset
related to state tax net operating losses. The non-U.S. net deferred tax asset of $604 million is comprised principally of net operating
and capital loss carryforwards, mainly in Germany, France and the United Kingdom. We maintain a valuation allowance of $438
million against such net asset reflecting our historical experience and lower expectations of taxable income over the applicable
carryforward periods. As more fully described in Note 7 of Notes to Financial Statements in “Item 8. Financial Statements and
Supplementary Data”, our valuation allowance increased by $139, $39 and $108 million in 2005, 2004 and 2003, respectively. In the
event we determine that we will not be able to realize our net deferred tax assets in the future, we will reduce such amounts through a
charge to income in the period such determination is made. Conversely, if we determine that we will be able to realize net deferred tax
assets in excess of the carrying amounts, we will decrease the recorded valuation allowance through a credit to income or a credit to
goodwill in the period that such determination is made. If a valuation allowance is recognized for the net deferred tax asset for an
acquired entity's deductible temporary differences, operating loss, capital loss, or tax credit carryforwards at the acquisition date, the
tax benefits for those items recognized after the acquisition date shall be applied first to reduce to zero goodwill related to the
acquisition, second to reduce to zero other non-current intangible assets related to the acquisition, and third to reduce income tax
expense.
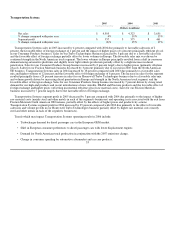
Sales Recognition on Long-Term Contracts—In 2005, we recognized approximately 10 percent of our total net sales using the
percentage-of-completion method for long-term contracts in our Automation and Control Solutions and Aerospace reportable
segments. These long-term contracts are measured on the cost-to-cost basis for engineering-type contracts and the units-of-delivery
basis for production-type contracts. Accounting for these contracts involves management judgment in estimating total contract
revenue and cost. Contract revenues are largely determined by negotiated contract prices and quantities, modified by our assumptions
regarding contract options, change orders, incentive and award provisions associated with technical performance and price adjustment
clauses (such as inflation or index-based clauses). Contract costs are incurred over a period of time, which can be several years, and
the estimation of these costs requires management judgment. Cost estimates are largely based on negotiated or estimated purchase
contract terms, historical performance trends and other economic projections. Significant factors that influence these estimates include
inflationary
24