Honeywell 2005 Annual Report Download - page 31
Download and view the complete annual report
Please find page 31 of the 2005 Honeywell annual report below. You can navigate through the pages in the report by either clicking on the pages listed below, or by using the keyword search tool below to find specific information within the annual report.-
 1
1 -
2
-
3
-
4
-
5
-
6
-
7
-
8
-
9
-
10
-
11
-
12
-
13
-
14
-
15
-
16
-
17
-
18
-
19
-
20
-
 21
21 -
 22
22 -
 23
23 -
 24
24 -
 25
25 -
 26
26 -
 27
27 -
 28
28 -
 29
29 -
 30
30 -
 31
31 -
 32
32 -
 33
33 -
 34
34 -
 35
35 -
 36
36 -
 37
37 -
 38
38 -
 39
39 -
 40
40 -
 41
41 -
42
-
43
-
44
-
45
-
46
-
47
-
48
-
49
-
50
-
51
-
52
-
53
-
54
-
55
-
56
-
57
-
58
-
59
-
60
-
61
-
62
-
63
-
64
-
65
-
66
-
67
-
68
-
69
-
70
-
71
-
72
-
73
-
74
-
75
-
76
-
77
-
78
-
79
-
80
-
81
-
82
-
83
-
84
-
85
-
86
-
87
-
88
-
89
-
90
-
91
-
92
-
93
-
94
-
95
-
96
-
97
-
98
-
99
-
100
-
101
-
102
-
103
-
104
-
105
-
106
-
107
-
108
-
109
-
110
-
111
-
112
-
113
-
114
-
115
-
116
-
117
-
118
-
119
-
120
-
121
-
122
-
123
-
124
-
125
-
126
-
127
-
128
-
129
-
130
-
131
-
132
-
133
-
134
-
135
-
136
-
137
-
138
-
139
-
140
-
141
-
142
-
143
-
144
-
145
-
146
-
147
-
148
-
149
-
150
-
151
-
152
-
153
-
154
-
155
-
156
-
157
-
158
-
159
-
160
-
161
-
162
-
163
-
164
-
165
-
166
-
167
-
168
-
169
-
170
-
171
-
172
-
173
-
174
-
175
-
176
-
177
-
178
-
179
-
180
-
181
-
182
-
183
-
184
-
185
-
186
-
187
-
188
-
189
-
190
-
191
-
192
-
193
-
194
-
195
-
196
-
197
-
198
-
199
-
200
-
201
-
202
-
203
-
204
-
205
-
206
-
207
-
208
-
209
-
210
-
211
-
212
-
213
-
214
-
215
-
216
-
217
-
218
-
219
-
220
-
221
-
222
-
223
-
224
-
225
-
226
-
227
-
228
-
229
-
230
-
231
-
232
-
233
-
234
-
235
-
236
-
237
-
238
-
239
-
240
-
241
-
242
-
243
-
244
-
245
-
246
-
247
-
248
-
249
-
250
-
251
-
252
-
253
-
254
-
255
-
256
-
257
-
258
-
259
-
260
-
261
-
262
-
263
-
264
-
265
-
266
-
267
-
268
-
269
-
270
-
271
-
272
-
273
-
274
-
275
-
276
-
277
-
278
-
279
-
280
-
281
-
282
-
283
-
284
-
285
-
286
 |
 |

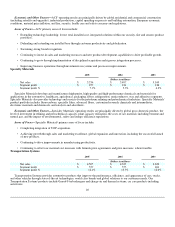
Economic and Other Factors—ACS' operating results are principally driven by global residential and commercial construction
(including retrofits and upgrades), industrial production, capital spending on process and building automation, European economic
conditions, material price inflation, and fire, security, health care and safety concerns and regulations.
Areas of Focus—ACS' primary areas of focus include:
• Extending technology leadership: lowest total installed cost, integrated solutions within our security, fire and sensors product
portfolios.
• Defending and extending our installed base through customer productivity and globalization.
• Sustaining strong brand recognition.
• Continuing to invest in sales and marketing resources and new product development capabilities to drive profitable growth.
• Continuing to grow through implementation of disciplined acquisition and rigorous integration processes.
• Improving business operations through investments in systems and processes improvements.
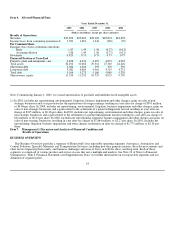
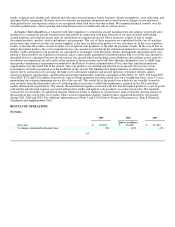
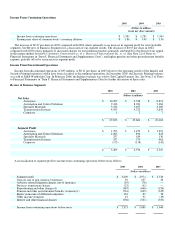
Specialty Materials
2005 2004 2003
(Dollars in millions)
Net sales $ 3,234 $ 3,497 $ 3,169
Segment profit $ 257 $ 184 $ 136
Segment profit % 7.9% 5.3% 4.3%
Specialty Materials develops and manufactures high-purity, high-quality and high-performance chemicals and materials for
applications in the automotive, healthcare, agricultural, packaging, fibers, refrigeration, semiconductor, wax and adhesives segments.
Specialty Materials also provides technology and services for the petroleum refining and petrochemical industries. Specialty Materials'
product portfolio includes fluorocarbons, specialty films, advanced fibers, customized research chemicals and intermediates,
electronic materials and chemicals, and catalysts and adsorbents.
Economic and Other Factors—Specialty Materials' operating results are principally driven by global gross domestic product, the
level of investment in refining and petrochemical capacity, plant capacity utilization, the costs of raw materials including benzene and
natural gas, and the impact of environmental, safety and energy efficiency regulations.
Areas of Focus—Specialty Materials' primary areas of focus include:
• Completing integration of UOP acquisition.
• Achieving growth through sales and marketing excellence, global expansion and innovation, including the successful launch
of new products.
• Continuing to drive improvements in manufacturing productivity.
• Continuing to offset raw material cost increases with formula price agreements and price increases, where feasible.
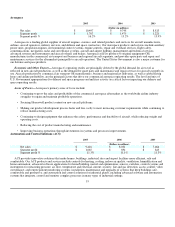
Transportation Systems
2005 2004 2003
(Dollars in millions)
Net sales $ 4,505 $ 4,323 $ 3,650
Segment profit $ 557 $ 575 $ 461
Segment profit % 12.4% 13.3% 12.6%
Transportation Systems provides automotive products that improve the performance, efficiency, and appearance of cars, trucks,
and other vehicles through state-of-the-art technologies, world class brands and global solutions to our customers needs. Our
Transportation Systems' products include Garrett® turbochargers and charge-air and thermal systems; car care products including
anti-freeze
20