Honeywell 2005 Annual Report Download - page 37
Download and view the complete annual report
Please find page 37 of the 2005 Honeywell annual report below. You can navigate through the pages in the report by either clicking on the pages listed below, or by using the keyword search tool below to find specific information within the annual report.-
 1
1 -
2
-
3
-
4
-
5
-
6
-
7
-
8
-
9
-
10
-
11
-
12
-
13
-
14
-
15
-
16
-
17
-
18
-
19
-
20
-
21
-
22
-
23
-
24
-
25
-
26
-
 27
27 -
 28
28 -
 29
29 -
 30
30 -
 31
31 -
 32
32 -
 33
33 -
 34
34 -
 35
35 -
 36
36 -
 37
37 -
 38
38 -
 39
39 -
 40
40 -
 41
41 -
 42
42 -
 43
43 -
 44
44 -
 45
45 -
 46
46 -
 47
47 -
48
-
49
-
50
-
51
-
52
-
53
-
54
-
55
-
56
-
57
-
58
-
59
-
60
-
61
-
62
-
63
-
64
-
65
-
66
-
67
-
68
-
69
-
70
-
71
-
72
-
73
-
74
-
75
-
76
-
77
-
78
-
79
-
80
-
81
-
82
-
83
-
84
-
85
-
86
-
87
-
88
-
89
-
90
-
91
-
92
-
93
-
94
-
95
-
96
-
97
-
98
-
99
-
100
-
101
-
102
-
103
-
104
-
105
-
106
-
107
-
108
-
109
-
110
-
111
-
112
-
113
-
114
-
115
-
116
-
117
-
118
-
119
-
120
-
121
-
122
-
123
-
124
-
125
-
126
-
127
-
128
-
129
-
130
-
131
-
132
-
133
-
134
-
135
-
136
-
137
-
138
-
139
-
140
-
141
-
142
-
143
-
144
-
145
-
146
-
147
-
148
-
149
-
150
-
151
-
152
-
153
-
154
-
155
-
156
-
157
-
158
-
159
-
160
-
161
-
162
-
163
-
164
-
165
-
166
-
167
-
168
-
169
-
170
-
171
-
172
-
173
-
174
-
175
-
176
-
177
-
178
-
179
-
180
-
181
-
182
-
183
-
184
-
185
-
186
-
187
-
188
-
189
-
190
-
191
-
192
-
193
-
194
-
195
-
196
-
197
-
198
-
199
-
200
-
201
-
202
-
203
-
204
-
205
-
206
-
207
-
208
-
209
-
210
-
211
-
212
-
213
-
214
-
215
-
216
-
217
-
218
-
219
-
220
-
221
-
222
-
223
-
224
-
225
-
226
-
227
-
228
-
229
-
230
-
231
-
232
-
233
-
234
-
235
-
236
-
237
-
238
-
239
-
240
-
241
-
242
-
243
-
244
-
245
-
246
-
247
-
248
-
249
-
250
-
251
-
252
-
253
-
254
-
255
-
256
-
257
-
258
-
259
-
260
-
261
-
262
-
263
-
264
-
265
-
266
-
267
-
268
-
269
-
270
-
271
-
272
-
273
-
274
-
275
-
276
-
277
-
278
-
279
-
280
-
281
-
282
-
283
-
284
-
285
-
286
 |
 |

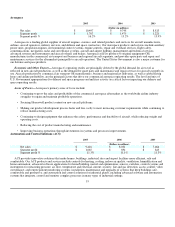
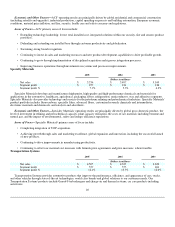
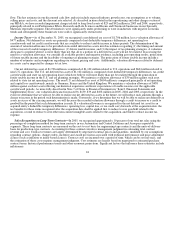
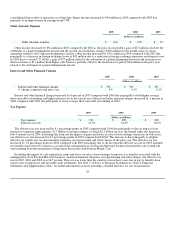
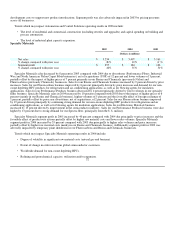
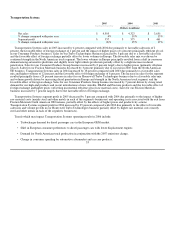
The change in net sales in 2005 and 2004 is attributable to the following:
2005
Versus
2004
2004
Versus
2003
Acquisitions 5% 1%
Divestitures (2) (1)
Price 1 —
Volume 4 8
Foreign Exchange — 3
8% 11%
A discussion of net sales by reportable segment can be found in the Review of Business Segments section of this Management's
Discussion and Analysis of Financial Condition and Results of Operations (MD&A).
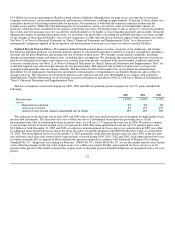
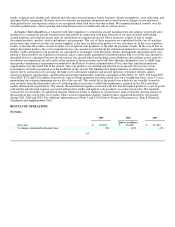
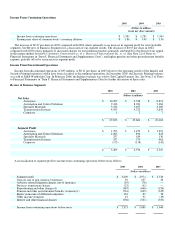
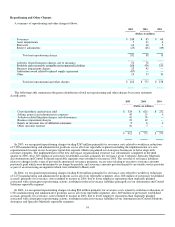
Cost of Products and Services Sold
2005 2004 2003
(Dollars in millions)
Cost of products and services sold $ 21,465 $ 20,585 $ 18,235
Gross margin% 22.4% 19.6% 21.1%
Gross margin increased in 2005 by 2.8 percentage points compared with 2004. The increase resulted from an increase of 1.1
percentage points in gross margin for our reportable segments (see Review of Business Segments for a discussion of our segment
results). The increase also resulted from lower repositioning and other charges of 1.2 percentage points and lower pension and other
postretirement benefits expense of 0.5 percentage points. Gross margin decreased in 2004 by 1.5 percentage points compared with
2003. The decrease resulted primarily from an increase in repositioning and other charges of 1.2 percentage points and higher pension
and other postretirement benefits expense of 0.9 percentage points partially offset by an increase of 0.6 percentage points in gross
margin for our reportable segments (see Review of Business Segments for a discussion of our segment results).
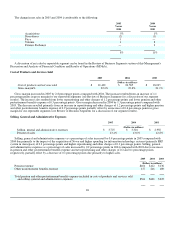
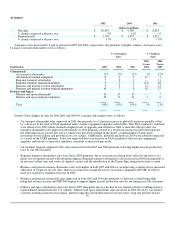
Selling, General and Administrative Expenses
2005 2004 2003
(Dollars in millions)
Selling, general and administrative expenses $ 3,707 $ 3,316 $ 2,950
Percent of sales 13.4% 13.0% 12.8%
Selling, general and administrative expenses as a percentage of sales increased by 0.4 percentage points in 2005 compared with
2004 due primarily to the impact of the acquisition of Novar and higher spending for information technology systems (primarily ERP
system in Aerospace) of 0.3 percentage points and higher repositioning and other charges of 0.1 percentage points. Selling, general
and administrative expenses as a percentage of sales increased by 0.2 percentage points in 2004 compared with 2003 due to increases
in pension and other postretirement benefits expense and net repositioning and other charges of 0.2 and 0.1 percentage points,
respectively, partially offset by a decrease of 0.1 percentage points due primarily to higher sales.
2005 2004 2003
(Dollars in millions)
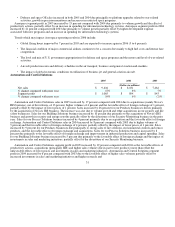
Pension expense $404 $412 $136
Other postretirement benefits expense 157 216 189
Total pension and other postretirement benefits expense included in costs of products and services sold
and selling, general and administrative expenses $561 $628 $325
26