Honeywell 2005 Annual Report Download - page 76
Download and view the complete annual report
Please find page 76 of the 2005 Honeywell annual report below. You can navigate through the pages in the report by either clicking on the pages listed below, or by using the keyword search tool below to find specific information within the annual report.-
 1
1 -
2
-
3
-
4
-
5
-
6
-
7
-
8
-
9
-
10
-
11
-
12
-
13
-
14
-
15
-
16
-
17
-
18
-
19
-
20
-
21
-
22
-
23
-
24
-
25
-
26
-
27
-
28
-
29
-
30
-
31
-
32
-
33
-
34
-
35
-
36
-
37
-
38
-
39
-
40
-
41
-
42
-
43
-
44
-
45
-
46
-
47
-
48
-
49
-
50
-
51
-
52
-
53
-
54
-
55
-
56
-
57
-
58
-
59
-
60
-
61
-
62
-
63
-
64
-
65
-
 66
66 -
 67
67 -
 68
68 -
 69
69 -
 70
70 -
 71
71 -
 72
72 -
 73
73 -
 74
74 -
 75
75 -
 76
76 -
 77
77 -
 78
78 -
 79
79 -
 80
80 -
 81
81 -
 82
82 -
 83
83 -
 84
84 -
 85
85 -
 86
86 -
87
-
88
-
89
-
90
-
91
-
92
-
93
-
94
-
95
-
96
-
97
-
98
-
99
-
100
-
101
-
102
-
103
-
104
-
105
-
106
-
107
-
108
-
109
-
110
-
111
-
112
-
113
-
114
-
115
-
116
-
117
-
118
-
119
-
120
-
121
-
122
-
123
-
124
-
125
-
126
-
127
-
128
-
129
-
130
-
131
-
132
-
133
-
134
-
135
-
136
-
137
-
138
-
139
-
140
-
141
-
142
-
143
-
144
-
145
-
146
-
147
-
148
-
149
-
150
-
151
-
152
-
153
-
154
-
155
-
156
-
157
-
158
-
159
-
160
-
161
-
162
-
163
-
164
-
165
-
166
-
167
-
168
-
169
-
170
-
171
-
172
-
173
-
174
-
175
-
176
-
177
-
178
-
179
-
180
-
181
-
182
-
183
-
184
-
185
-
186
-
187
-
188
-
189
-
190
-
191
-
192
-
193
-
194
-
195
-
196
-
197
-
198
-
199
-
200
-
201
-
202
-
203
-
204
-
205
-
206
-
207
-
208
-
209
-
210
-
211
-
212
-
213
-
214
-
215
-
216
-
217
-
218
-
219
-
220
-
221
-
222
-
223
-
224
-
225
-
226
-
227
-
228
-
229
-
230
-
231
-
232
-
233
-
234
-
235
-
236
-
237
-
238
-
239
-
240
-
241
-
242
-
243
-
244
-
245
-
246
-
247
-
248
-
249
-
250
-
251
-
252
-
253
-
254
-
255
-
256
-
257
-
258
-
259
-
260
-
261
-
262
-
263
-
264
-
265
-
266
-
267
-
268
-
269
-
270
-
271
-
272
-
273
-
274
-
275
-
276
-
277
-
278
-
279
-
280
-
281
-
282
-
283
-
284
-
285
-
286
 |
 |

HONEYWELL INTERNATIONAL INC.
NOTES TO FINANCIAL STATEMENTS—(Continued)
(Dollars in millions, except per share amounts)
with Issue 8(a) of EITF 01-2, “Interpretations of APB Opinion No. 29”. Accordingly, the pre-tax gain on the sale of our Engineering
Plastics business of $38 million was based on the fair value of the consideration received from BASF less the sum of the net book
value of our Engineering Plastics business and related transaction costs. We recorded the assets and liabilities acquired in the BASF
business at fair market value based on a valuation performed by a third party valuation consultant at the acquistion date which
corresponded to the value agreed upon in the asset purchase agreement for this transaction. Specialty Materials' Engineering Plastics
business and BASF's nylon fiber business both had annual sales of approximately $400 million.
In connection with all acquisitions in 2005, 2004 and 2003, except for the Novar acquisition as described above, the amounts
recorded for transaction costs and the costs of integrating the acquired businesses into Honeywell were not material. The results of
operations of all acquired businesses have been included in the consolidated results of Honeywell from their respective acquisition
dates. The pro forma results for 2005, 2004 and 2003, assuming these acquisitions had been made at the beginning of the year, would
not be materially different from reported results.
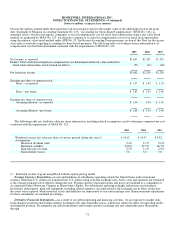
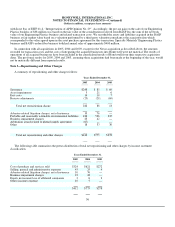
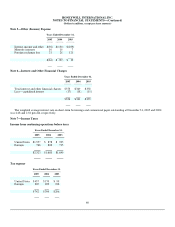
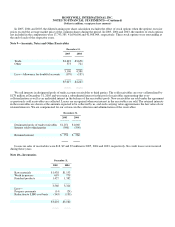
Note 3—Repositioning and Other Charges
A summary of repositioning and other charges follows:
Years Ended December 31,
2005 2004 2003
Severance $248 $ 85 $ 69
Asset impairments 5 21 6
Exit costs 14 10 7
Reserve adjustments (25) (28) (69)
Total net repositioning charge 242 88 13
Asbestos related litigation charges, net of insurance 10 76 —
Probable and reasonably estimable environmental liabilities 186 536 235
Business impairment charges 23 42 —
Arbitration award related to phenol supply agreement (67) — —
Other 18 33 30
Total net repositioning and other charges $412 $775 $278
The following table summarizes the pretax distribution of total net repositioning and other charges by income statement
classification.
Years Ended December 31,
2005 2004 2003
Cost of products and services sold $324 $621 $272
Selling, general and administrative expenses 43 25 4
Asbestos related litigation charges, net of insurance 10 76 —
Business impairment charges 23 42 —
Equity in (income) loss of affiliated companies 2 6 2
Other (income) expense 10 5 —
$412 $775 $278
56