Honeywell 2005 Annual Report Download - page 84
Download and view the complete annual report
Please find page 84 of the 2005 Honeywell annual report below. You can navigate through the pages in the report by either clicking on the pages listed below, or by using the keyword search tool below to find specific information within the annual report.-
 1
1 -
2
-
3
-
4
-
5
-
6
-
7
-
8
-
9
-
10
-
11
-
12
-
13
-
14
-
15
-
16
-
17
-
18
-
19
-
20
-
21
-
22
-
23
-
24
-
25
-
26
-
27
-
28
-
29
-
30
-
31
-
32
-
33
-
34
-
35
-
36
-
37
-
38
-
39
-
40
-
41
-
42
-
43
-
44
-
45
-
46
-
47
-
48
-
49
-
50
-
51
-
52
-
53
-
54
-
55
-
56
-
57
-
58
-
59
-
60
-
61
-
62
-
63
-
64
-
65
-
66
-
67
-
68
-
69
-
70
-
71
-
72
-
73
-
 74
74 -
 75
75 -
 76
76 -
 77
77 -
 78
78 -
 79
79 -
 80
80 -
 81
81 -
 82
82 -
 83
83 -
 84
84 -
 85
85 -
 86
86 -
 87
87 -
 88
88 -
 89
89 -
 90
90 -
 91
91 -
 92
92 -
 93
93 -
 94
94 -
95
-
96
-
97
-
98
-
99
-
100
-
101
-
102
-
103
-
104
-
105
-
106
-
107
-
108
-
109
-
110
-
111
-
112
-
113
-
114
-
115
-
116
-
117
-
118
-
119
-
120
-
121
-
122
-
123
-
124
-
125
-
126
-
127
-
128
-
129
-
130
-
131
-
132
-
133
-
134
-
135
-
136
-
137
-
138
-
139
-
140
-
141
-
142
-
143
-
144
-
145
-
146
-
147
-
148
-
149
-
150
-
151
-
152
-
153
-
154
-
155
-
156
-
157
-
158
-
159
-
160
-
161
-
162
-
163
-
164
-
165
-
166
-
167
-
168
-
169
-
170
-
171
-
172
-
173
-
174
-
175
-
176
-
177
-
178
-
179
-
180
-
181
-
182
-
183
-
184
-
185
-
186
-
187
-
188
-
189
-
190
-
191
-
192
-
193
-
194
-
195
-
196
-
197
-
198
-
199
-
200
-
201
-
202
-
203
-
204
-
205
-
206
-
207
-
208
-
209
-
210
-
211
-
212
-
213
-
214
-
215
-
216
-
217
-
218
-
219
-
220
-
221
-
222
-
223
-
224
-
225
-
226
-
227
-
228
-
229
-
230
-
231
-
232
-
233
-
234
-
235
-
236
-
237
-
238
-
239
-
240
-
241
-
242
-
243
-
244
-
245
-
246
-
247
-
248
-
249
-
250
-
251
-
252
-
253
-
254
-
255
-
256
-
257
-
258
-
259
-
260
-
261
-
262
-
263
-
264
-
265
-
266
-
267
-
268
-
269
-
270
-
271
-
272
-
273
-
274
-
275
-
276
-
277
-
278
-
279
-
280
-
281
-
282
-
283
-
284
-
285
-
286
 |
 |

HONEYWELL INTERNATIONAL INC.
NOTES TO FINANCIAL STATEMENTS—(Continued)
(Dollars in millions, except per share amounts)
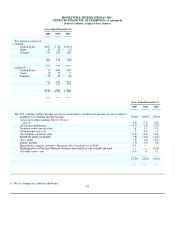
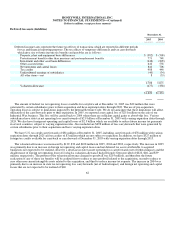
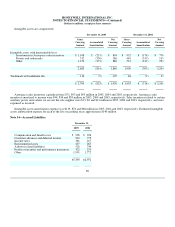
Deferred tax assets (liabilities)
December 31,
2005 2004
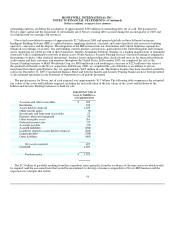
Deferred income taxes represent the future tax effects of transactions which are reported in different periods
for tax and financial reporting purposes. The tax effects of temporary differences and tax carryforwards
which give rise to future income tax benefits and payables are as follows:
Property, plant and equipment basis differences $ (582) $ (509)
Postretirement benefits other than pensions and postemployment benefits 771 748
Investment and other asset basis differences (342) (205)
Other accrued items 642 558
Net operating and capital losses 841 706
Tax credits 408 440
Undistributed earnings of subsidiaries (40) (34)
All other items—net 8 (33)
1,706 1,671
Valuation allowance (477) (338)
$1,229 $1,333
The amount of federal tax net operating losses available for carryforward at December 31, 2005 was $22 million that were
generated by certain subsidiaries prior to their acquisition and have expiration dates through 2022. The use of pre-acquisition
operating losses is subject to limitations imposed by the Internal Revenue Code. We do not anticipate that these limitations will affect
utilization of the carryforwards prior to their expiration. In 2005, we reported a net capital loss of $251 million on the sale of our
Industrial Wax business. This loss will be carried back to 2004 where there are sufficient capital gains to absorb this loss. Various
subsidiaries have state tax net operating loss carryforwards of $2.9 billion at December 31, 2005 with varying expiration dates through
2024. We also have foreign net operating and capital losses of $2.3 billion which are available to reduce future income tax payments
in several countries, subject to varying expiration rules. Also included are $698 million of loss carryforwards that were generated by
certain subsidiaries prior to their acquisition and have varying expiration dates.
We have U.S. tax credit carryforwards of $81 million at December 31, 2005, including carryforwards of $78 million with various
expiration dates through 2025 and tax credits of $3 million which are not subject to expiration. In addition, we have $327 million of
foreign tax credits available for carryback or carryforward at December 31, 2005 with varying expiration dates through 2015.
The valuation allowance was increased by $139, $39 and $108 million in 2005, 2004 and 2003, respectively. The increase in 2005
was primarily due to an increase in foreign net operating and capital losses and net deferred tax assets attributable to acquired
businesses not expected to be realized, offset by a decrease in state tax net operating loss carryforwards (net of federal impact) and the
disallowance of foreign net operating losses for which a valuation allowance had previously been provided of $222, $46, and $39
million, respectively. The portion of the valuation allowance charged to goodwill was $219 million, and therefore the future
realization of any of these tax benefits will be credited first to reduce to zero goodwill related to the acquisition, second to reduce to
zero other non current intangible assets related to the acquisition, and third to reduce income tax expense. The increase in 2004 was
primarily due to an increase in state tax net operating loss carryforwards (net of federal impact) and foreign net operating and capital
losses that are not expected to be realized of $40
62