Honeywell 2005 Annual Report Download - page 39
Download and view the complete annual report
Please find page 39 of the 2005 Honeywell annual report below. You can navigate through the pages in the report by either clicking on the pages listed below, or by using the keyword search tool below to find specific information within the annual report.-
 1
1 -
2
-
3
-
4
-
5
-
6
-
7
-
8
-
9
-
10
-
11
-
12
-
13
-
14
-
15
-
16
-
17
-
18
-
19
-
20
-
21
-
22
-
23
-
24
-
25
-
26
-
27
-
28
-
 29
29 -
 30
30 -
 31
31 -
 32
32 -
 33
33 -
 34
34 -
 35
35 -
 36
36 -
 37
37 -
 38
38 -
 39
39 -
 40
40 -
 41
41 -
 42
42 -
 43
43 -
 44
44 -
 45
45 -
 46
46 -
 47
47 -
 48
48 -
 49
49 -
50
-
51
-
52
-
53
-
54
-
55
-
56
-
57
-
58
-
59
-
60
-
61
-
62
-
63
-
64
-
65
-
66
-
67
-
68
-
69
-
70
-
71
-
72
-
73
-
74
-
75
-
76
-
77
-
78
-
79
-
80
-
81
-
82
-
83
-
84
-
85
-
86
-
87
-
88
-
89
-
90
-
91
-
92
-
93
-
94
-
95
-
96
-
97
-
98
-
99
-
100
-
101
-
102
-
103
-
104
-
105
-
106
-
107
-
108
-
109
-
110
-
111
-
112
-
113
-
114
-
115
-
116
-
117
-
118
-
119
-
120
-
121
-
122
-
123
-
124
-
125
-
126
-
127
-
128
-
129
-
130
-
131
-
132
-
133
-
134
-
135
-
136
-
137
-
138
-
139
-
140
-
141
-
142
-
143
-
144
-
145
-
146
-
147
-
148
-
149
-
150
-
151
-
152
-
153
-
154
-
155
-
156
-
157
-
158
-
159
-
160
-
161
-
162
-
163
-
164
-
165
-
166
-
167
-
168
-
169
-
170
-
171
-
172
-
173
-
174
-
175
-
176
-
177
-
178
-
179
-
180
-
181
-
182
-
183
-
184
-
185
-
186
-
187
-
188
-
189
-
190
-
191
-
192
-
193
-
194
-
195
-
196
-
197
-
198
-
199
-
200
-
201
-
202
-
203
-
204
-
205
-
206
-
207
-
208
-
209
-
210
-
211
-
212
-
213
-
214
-
215
-
216
-
217
-
218
-
219
-
220
-
221
-
222
-
223
-
224
-
225
-
226
-
227
-
228
-
229
-
230
-
231
-
232
-
233
-
234
-
235
-
236
-
237
-
238
-
239
-
240
-
241
-
242
-
243
-
244
-
245
-
246
-
247
-
248
-
249
-
250
-
251
-
252
-
253
-
254
-
255
-
256
-
257
-
258
-
259
-
260
-
261
-
262
-
263
-
264
-
265
-
266
-
267
-
268
-
269
-
270
-
271
-
272
-
273
-
274
-
275
-
276
-
277
-
278
-
279
-
280
-
281
-
282
-
283
-
284
-
285
-
286
 |
 |

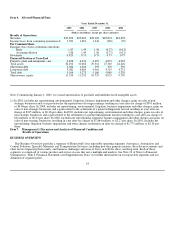
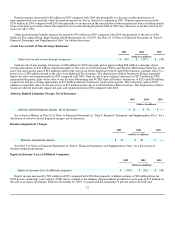
consolidated their results of operations as of that date. Equity income increased by $44 million in 2004 compared with 2003 due
primarily to an improvement in earnings from UOP.
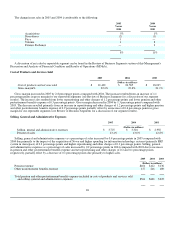
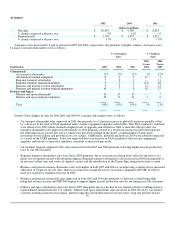
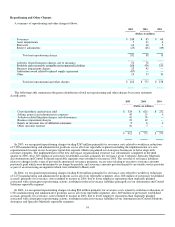
Other (Income) Expense
2005 2004 2003
(Dollars in millions)
Other (income) expense $ (61) $ (92) $ 19
Other income decreased by $31 million in 2005 compared with 2004 as the prior year included a gain of $27 million related to the
settlement of a patent infringement lawsuit and the current year included a charge of $10 million for the modification of a lease
agreement related to the Corporate headquarters facility. Other income increased by $111 million in 2004 compared with 2003 due
principally to a decrease in foreign exchange losses of $93 million due to a reduction in foreign exchange exposures resulting in losses
in 2003 due to a weak U.S. dollar, a gain of $27 million related to the settlement of a patent infringement lawsuit and an increase in
interest income of $13 million from higher cash balances, partially offset by the inclusion of a gain of $20 million in the prior year
related to the settlement of a patent infringement lawsuit.
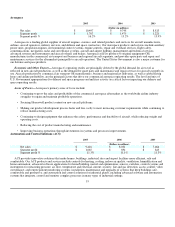
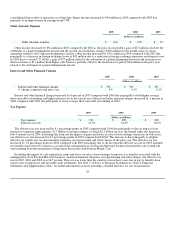
Interest and Other Financial Charges
2005 2004 2003
(Dollars in millions)
Interest and other financial charges $ 356 $ 331 $ 335
% change compared with prior year 8% (1)% (3)%
Interest and other financial charges increased by 8 percent in 2005 compared with 2004 due principally to both higher average
short-term debt outstanding and higher interest rates in the current year. Interest and other financial charges decreased by 1 percent in
2004 compared with 2003 due principally to lower average short-term debt outstanding in 2004.
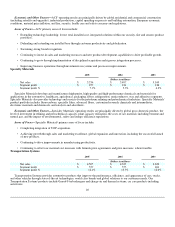
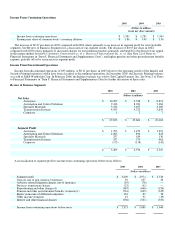
Tax Expense
2005 2004 2003
(Dollars in millions)
Tax expense $ 742 $ 399 $ 296
Effective tax rate 31.9% 23.8% 18.0%
The effective tax rate increased by 8.1 percentage points in 2005 compared with 2004 due principally to the tax impact of our
decision to repatriate approximately $2.7 billion of foreign earnings, of which $2.2 billion receives the benefit under the American
Jobs Creation Act of 2004. Excluding this item and the impact of gains and losses on sales of non-strategic businesses in both years,
our effective tax rate increased by 6.5 percentage points in 2005 compared with 2004. This increase is due principally to a higher
effective tax benefit rate on environmental, litigation, net repositioning and other charges in the prior year. The effective tax rate
increased by 5.8 percentage points in 2004 compared with 2003 principally due to the fact that the effective tax rate in 2003 included
tax benefits expected to be realized as a result of the redesignation of our Friction Materials business from held for sale to held and
used resulting from the termination of disposition discussions with Federal-Mogul Corp.
Excluding the impact of cash repatriation, gains and losses on sales of non-strategic businesses, tax benefits associated with the
redesignation of our Friction Materials business, and environmental, litigation, net repositioning and other charges, the effective tax
rate in 2005, 2004 and 2003 was 26.5 percent. This rate was lower than the statutory rate in those years due in part to benefits from
export sales, foreign taxes and favorable audit settlements. See Note 7 of Notes to Financial Statements in “Item 8. Financial
Statements and Supplementary Data” for further information on taxes including a detailed effective tax rate reconciliation.
28